Blog

Home

Blog

  • How to Select the Right Energy Storage System for Commercial Solar Projects

    How to Select the Right Energy Storage System for Commercial Solar Projects

    Oct 22, 2026
    The storage system, not the PV array, usually decides whether your commercial solar project pencils out. Most selection mistakes happen before you request any quote. Vendors then send different chemistries, architectures, and capacity figures, and you cannot tell which numbers to trust. To select the right energy storage system, size it first, compare options, stress-test the ROI, then vet suppliers.   Key Takeaways Size your battery system correctly by matching power and capacity to your load profile. Compare AC-coupled and DC-coupled systems and battery chemistries to fit your project needs. Vet suppliers using a scorecard and demand safety certifications and clear warranty terms.   How to Select the Right Energy Storage System: Sizing Basics Battery systems dominate commercial storage because they store electricity directly and discharge it when your business needs power. Sizing is the first step, and it decides everything that follows. Get the numbers wrong here, and no chemistry or warranty can rescue the project.   kW vs. kWh: Power Rating and Usable Capacity Two specifications carry most of the weight. The power rating, measured in kW, tells you how much power the system can deliver or absorb at one moment. Usable capacity, measured in kWh, tells you how much energy it can store and release over time. A system can have a large tank and a small pipe, or the reverse. Your load profile decides which limit binds first. Round-trip efficiency is the third specification, and buyers often overlook it. Electricity is converted, stored, managed, and converted again, with losses at every step. Cell resistance turns energy into heat, cooling systems consume power, and AC/DC conversions each lose a fraction. Small efficiency gaps compound under daily cycling:   System Capacity Cycles Per Year Round-Trip Efficiency Annual Energy Loss 100 MWh 365 90% 3,650 MWh lost   BESS Sizing With a Worked Example Start with a simple estimate: usable energy equals load power multiplied by discharge duration. A project needing 50 kW for 2 hours requires about 100 kWh of usable energy. Treat these figures as illustrative assumptions, not measured performance. Nameplate capacity will not deliver that 100 kWh. According to Ace Battery's comparison of rated versus usable energy, usable energy typically falls within 80%–95% of rated capacity, a shortfall of roughly 5%–20% driven by depth of discharge and round-trip efficiency. Depth of discharge matters on its own: Most modern lithium-ion batteries have DoDs ranging anywhere from 80% to 95%, with many best-in-class solutions sporting 100% depth of discharge and a much longer lifespan. Divide your energy requirement by the DoD, then divide again by round-trip efficiency, and you approach a realistic nameplate figure. Add margin for operating reserve, temperature, and degradation. Thermal performance drives available capacity and aging, so cooling strategy is a sizing decision, not an accessory. Peak-shaving projects need more analysis still: 12–24 months of interval load data, demand-charge rules, the charging window, and battery power limits. Both oversizing and undersizing hurt ROI.   Comparing Architectures, Chemistries, and ROI AC-Coupled vs. DC-Coupled Systems Your coupling choice depends on whether the solar array already exists. AC-coupled systems keep the existing solar inverter and add a separate battery inverter. That makes AC coupling the more affordable path for a retrofit, because you preserve equipment you already own. DC-coupled systems route electricity from the panels straight to the battery over a DC bus. Fewer conversions mean higher charging efficiency from solar, and a single hybrid inverter can cut equipment duplication in a new build. DC coupling also creates one point of common coupling, which reduces interconnection study costs compared with multiple connection points. Match the architecture to your project stage. New-build solar-plus-storage projects in the hundreds-of-kilowatts range suit DC coupling, especially when you value PV-to-battery round-trip efficiency. Retrofits and projects needing consistent performance across grid charging and solar charging fit AC coupling well. Evaluate cost in two layers: upfront installation and long-term operating value. This step matters when you select the right energy storage system for an existing array.   Battery Chemistry and Payback Drivers Chemistry sets your cycling profile and your space budget. LFP cells typically deliver roughly 3,000–8,000+ cycles, while NMC cells deliver roughly 1,000–3,000 cycles. LFP also offers a larger thermal safety margin and needs no nickel or cobalt. NMC wins on energy density, at roughly 200–300 Wh/kg against 90–205 Wh/kg for LFP, so it fits space-constrained sites. For daily-cycled stationary storage, LFP usually improves lifecycle value; NMC remains appropriate where compact size outweighs cycle life. Now stress-test the ROI. Build savings from electricity bill reductions and demand-charge reduction, then subtract operating costs and lifecycle cost. Label every assumption clearly and avoid promising savings you cannot document. Chemistry, architecture, and cycling profile all feed the same payback model.   Vetting ESS Suppliers With Data and Standards Building a Supplier Scorecard A scorecard turns a stack of brochures into a comparable set of facts. Score every vendor on the same criteria: usable capacity at your site conditions and at year ten, power rating, round-trip efficiency stated AC-to-AC with auxiliary loads included, system architecture, and energy management capabilities. Add safety documentation and certifications, warranty terms, manufacturing capability, and after-sales service. Use a shared 1–5 scale across technical fit, evidence quality, delivery capability, integration scope, and after-sales support. Record the supporting evidence beside every rating, and assign an owner and date to each open gap. Safety documentation deserves its own line. Ask for UL 9540 system-level certification, UL 9540A test reports at cell, module, and unit levels, UL 1973 for modules and packs, UL 1741 for inverters, and IEC 62619 for industrial lithium cells. Many jurisdictions require both UL 9540 certification and UL 9540A test reports before granting project approval. A certified cell does not mean the full system is certified, so demand all three UL 9540A test levels. Warranty terms vary widely, and the headline number rarely tells the whole story: A representative performance guarantee reads: "We guarantee 80% capacity after 10 years" — but only if the system is cycled once daily, kept at 15–25°C, never discharged below 20%, avoids grid charging (for ITC compliance), limits depth of discharge to 90%, and operates exactly per a lengthy operational manual. Commercial systems in the 20 kWh to 2 MW range typically carry around 10 years of coverage, rated 5,000 cycles at 80% depth of discharge. Performance warranties for larger projects can run 15–20 years and cover power output, energy availability, throughput, and degradation limits. Score the conditions attached to each guarantee, not just its length.   From Specs to a Confident Purchase Standardized performance data supports comparison, risk mitigation, financing, and deal closing. Issue one common load-profile model to every vendor. Require identical outputs: year-one and year-ten usable capacity, bill savings on your actual tariff, auxiliary energy, and full levelized cost of storage. Then evaluate on three axes — technical fit, commercial terms, and service capability. Store 5–15 minute consolidated data in your asset performance management system so you can verify guarantees later. Choosing the right solar storage solution starts with understanding your project's electricity demand, solar generation profile, operating objectives, and local grid requirements. Commercial buyers and EPC contractors should compare battery capacity, power rating, system architecture, energy management capabilities, safety documentation, warranty terms, and lifecycle costs before making a purchasing decision. PNG Solar's relevant energy storage products and technical specifications can then be evaluated against these project requirements to identify a suitable configuration. Verify the actual product range, models, capacity, power, and technical parameters before publication.   Size your system by load profile, adjusting kW and kWh for efficiency and degradation. Compare architectures and chemistry against project needs, stress-test ROI assumptions, then score suppliers on documented performance and warranty terms. Confident decisions rest on project-specific data, not brochure capacity figures. That distinction separates a sound purchase from an expensive guess. Assemble your load data and demand-charge history before requesting quotes. Every supplier then competes on the same basis, and you can select the right energy storage system with evidence behind you.   FAQ How do I know whether my project needs more kW or more kWh? Check your load profile first. A short, intense demand spike calls for higher power rating. A long overnight backup window calls for more usable capacity. Your interval load data and demand-charge history reveal which limit binds first. Can I add storage to my existing solar array? Yes. AC-coupled systems keep your current solar inverter and add a separate battery inverter, which preserves equipment you already own. This path usually costs less than replacing working hardware for a retrofit. Which battery chemistry suits daily commercial cycling? LFP cells typically deliver roughly 3,000–8,000+ cycles, so they usually improve lifecycle value for daily-cycled stationary storage. NMC cells offer higher energy density at roughly 200–300 Wh/kg, which fits space-constrained sites better.
  • Bifacial Solar Modules for Utility Projects: Complete Installation and ROI Guide

    Bifacial Solar Modules for Utility Projects: Complete Installation and ROI Guide

    Oct 22, 2026
    Bifacial Solar Modules now anchor most utility ground-mount projects, yet installation practice and ROI math still decide whether they pay off. You need defensible numbers, not marketing claims. Remember one rule: bifaciality factor is not energy gain. Real gains are site- and design-specific, typically 8%–15% under optimal conditions. Monofacial remains a valid fit for some sites.   Key Takeaways Bifacial gain varies by site. Test your albedo, height, tilt, and spacing to find real energy gain. Design matters. Use trackers and proper spacing to boost rear-side light and lower costs. Model your ROI. Compare incremental cost and energy to see if bifacial pays off for your project.   What Bifacial Solar Modules Are and How They Differ Bifacial solar modules collect irradiance on both faces and convert light hitting the rear side into additional power. A transparent backsheet or dual-glass construction lets reflected light reach the rear cells. You gain energy from the same module area, mounting structure, and land footprint. That dual-face collection is the entire premise of the technology.   Bifaciality Factor vs. Energy Gain The bifaciality factor describes the module alone. It is the ratio of rear-side nominal efficiency to front-side nominal efficiency, measured under standard test conditions: Bifaciality factor (%) = [η_rear / η_front] × 100 A module with 350 W rear test power and 500 W front test power has a bifaciality of 350/500 = 70%. The rear face produces 70% of the front's capability under test light. This is a datasheet characteristic, not a field result. Energy gain is a system-level increment. It depends on how much light actually reaches the rear face at your site. ArcVera Renewables reports an average gain of 3% to 10%, and up to 30% depending on albedo, structure elevation height, and ground cover ratio. An 80% bifaciality rating never means 80% more energy.   Utility-Scale Fit and Tradeoffs Bifacial solar modules are now the de facto choice for utility ground-mount projects. Dual-glass construction and falling price premiums made them the default specification for new builds. Monofacial modules remain a valid fit for low-albedo ground or budget-constrained sites. Match the module to the site, not to a trend.   Site and Design Factors That Drive Performance Rear-side irradiance is not a fixed property of the module. Four site and design variables jointly determine how much reflected light reaches the back face: ground albedo, mounting height, tilt, and row spacing. Change one and the others shift in response.   Albedo, Height, Tilt, and Spacing Ground albedo sets the ceiling on reflected light. Fresh snow approaches an albedo near one in the visible region, while deep clean ocean water sits close to zero. Grass typically falls in the 0.15–0.25 range, light gravel and sand in the 0.30–0.45 range, and white membranes above 0.60. Moisture, aging, soiling, and sun angle all shift these values over the project life. Mounting height controls how much of that reflected light the rear face actually sees. Clearance below 0.5 m yields limited rear irradiance, with gains often under 5%. A minimum of roughly 0.8–1.0 m is recommended, and 1.2–2.0 m is optimal depending on module size and tilt. Taller posts widen the sunlit ground patch but raise wind loads and structural cost, so returns flatten quickly over dark ground. Tilt and row spacing interact with albedo and height. A slightly reduced tilt can raise rear exposure while marginally lowering front capture. Insufficient row spacing causes rear-side shading from adjacent rows, and optimal bifacial spacing typically runs 10%–30% larger than monofacial. Lower ground coverage ratio generally raises rear irradiance, while higher GCR packs more capacity per acre and compresses bifacial gain.   Factor Effect on rear-side irradiance Ground albedo Higher albedo substantially raises rear-side irradiance Mounting height Gains rise with clearance, then flatten; taller posts raise cost Tilt Optimum often differs from monofacial; slightly reduced tilt can help Row spacing Insufficient spacing causes rear-side shading from adjacent rows   Mounting and Electrical Design Tracker configurations elevate modules and reduce rear-side shading, conditions that directly enhance bifacial gain. Horizontal single-axis trackers with bifacial modules have become the industry standard for lowest LCOE. Single-axis trackers deliver 15–25% higher energy yield than fixed-tilt systems, with capacity factors typically 24–32%. Two-modules-in-portrait configurations add reduced rear shading, higher GCR, and fewer foundations per MW. String sizing cannot simply follow traditional calculations. Extra rear-side current shifts voltage and current behavior across the day, so engage designers experienced with bifacial-specific electrical requirements. Account for peak bifacial output when selecting controllers and inverters. Conventional irradiance measurements miss rear-side contributions, so monitor both front and rear irradiance plus module temperatures during the first year to establish a baseline and verify expected gains.   Modeling, Installation, and Fit Assessment Modeling Yield with Defensible Assumptions Build your yield case on three tiers of evidence. First, anchor assumptions in technical references: NREL and IEC standards, PVGIS irradiance data, and SAM simulation runs. Second, pull module parameters from the datasheet, including bifaciality, temperature coefficient, and maximum series fuse rating. Third, label every scenario model clearly as an estimate with stated inputs. Reference points help you sanity-check results. Published gains for bifacial solar modules reach 10–30% under optimal conditions, and a 5–8% upfront cost premium is a common planning figure. Treat both as ranges to test, not guarantees. Your albedo, height, and spacing assumptions drive the outcome.   Installation Sequence and Quality Checks Follow a fixed sequence, with a checkpoint at each stage: Survey the site and document ground albedo, rear-face obstructions, and snow patterns. Confirm design and current calculations against the correct Isc for conductors, fuses, inverters, and MLPE. Install foundations per the stamped structural design, holding post heights to plan. Set racking height, tilt, and row spacing, measuring clearance at the lowest module edge. Mount modules in approved clamp zones, inspecting for chipped edges or cracks at delivery. Route wiring away from the rear face, securing leads along rails or frame edges. Commission with polarity, insulation resistance, and I-V curve tracing, adding rear-side irradiance sensors on larger projects. Clamp discipline protects the glass. Match clamp length and position to the installation manual, confirm the approved mounting orientation, and torque to spec, since overtightening can crack glass and clamping outside approved zones can void the warranty. Ask for mechanical test data on the specific module and racking combination: Kiwa PVEL documented a Brazilian tracker site where over 50% of 2 mm glass-glass modules cracked within nine months.   Sourcing Bifacial Solar Modules for Utility Projects Specifications Buyers Should Compare Compare modules at the exact model level, not the brand level. A technology label is not evidence for the module you will actually receive. Request the current datasheet, the test method, and the supporting report before you place a bifaciality value into an energy model. Specification to compare Relevance to utility bifacial sourcing Rated power Determines module output Efficiency Affects power density and land utilization Bifaciality Relevant to rear-side generation Temperature coefficient Important in hot climates Degradation Influences long-term output Dimensions and weight Affect mounting, handling, and transport Voc / Isc Required for electrical system design Mechanical load Important for structural design Warranty Long-term risk consideration Certifications Market and project compliance Availability and price Affect schedule and economics Review first-year degradation, annual degradation, and end-of-warranty guaranteed output for the exact model. Compare temperature coefficients of power across your shortlist, especially for hot climates, rather than relying only on STC efficiency. Confirm tracker compatibility and approved mechanical loads before you commit.   Evaluating Manufacturers and Suppliers Verify the supplier before you negotiate price. Follow a fixed sequence: Check the business license in China's official registry to confirm legal identity and rule out trading companies posing as factories. Validate TÜV, CE, IEC 61215, and IEC 61730 certificates directly with the issuing laboratories. Request a video tour or an in-person visit to confirm real production lines. Send samples to an independent laboratory to verify bifacial performance claims. Contact 3–5 recent buyers about quality consistency and warranty handling. Run a pre-shipment inspection through SGS, Bureau Veritas, or TÜV. Certification alone no longer satisfies utility procurement. Pair it with bill-of-materials-specific bankability testing and ongoing production oversight. Confirm who handles warranty communication, which documents you must submit, and how technical escalations move. For a single accountable partner, PNG Solar supplies bifacial solar modules and utility-scale PV modules alongside full solar project solutions, from specification through delivery.   Calculating ROI for Bifacial Utility Projects Cost, Gain, and LCOE Formulas Start with four plain relations. Incremental cost = bifacial total upfront investment minus monofacial total upfront investment. Incremental energy = annual bifacial production minus annual monofacial production, summed across the project life after applying the degradation rate. LCOE delta = bifacial LCOE minus monofacial LCOE, where LCOE = total lifetime cost / total lifetime energy in MWh. Simple payback in years = incremental cost / annual revenue from incremental energy, with revenue = incremental MWh × PPA price. Run each relation on your own inputs. Do not borrow a published uplift percentage.   Scenario Analysis and Payback The table below states the assumptions for a 5 MW DC comparison against a mono PERC baseline. Assumption Value used in model Location and irradiance High-solar-irradiance area Ground surface Light-colored gravel, ~30% albedo System capacity 5,000 kW for both systems Baseline Year 1 production (mono PERC) ~7,500 MWh Bifacial gain Conservative 9% (675 MWh) PPA price ~$57/MWh Degradation rate ~0.5% per year Module cost ~$0.75/W mono, ~$0.90/W bifacial Inverter cost $300,000 for both Mounting and racking $750,000 vs. $825,000 Labor and installation $600,000 vs. $650,000 Other BOS and soft costs $1,100,000 for both Total upfront investment $6,500,000 vs. $7,375,000 System lifetime 25 years Incremental cost here is 875,000, roughly 13.5% higher. Year 1 incremental revenue is 675 MWh ×57/MWh, about $38,475. Divide $875,000 by that figure and simple payback lands near 23 years before degradation — a marginal case at this gain level. Studies cite 15–17% gains as possible on gravel, which would shorten payback substantially. Now vary albedo. Low-albedo ground such as dark soil or water-adjacent sites suppresses rear irradiance, and payback may exceed the asset life. Medium albedo, the gravel case above, sits near break-even. High albedo, such as snow or white membrane, pushes gain toward the upper published range and delivers the strongest payback. Interpret results as a range, not a single number, and stress-test the albedo assumption first. The FAQ section should answer discrete buyer questions rather than restate these calculations.   Prove bifacial value at your site. Model albedo, mounting design, and electrical configuration together, then link them to energy yield. Compare incremental cost against modeled incremental energy, and translate the result into LCOE and payback under stated assumptions. Verify datasheets, bifaciality ratings, temperature coefficients, certifications, and supplier delivery capability before you commit. Bifacial Solar Modules now lead utility-scale PV, and PNG Solar supports your project with utility-scale modules and complete solar project solutions.   FAQ Do bifacial modules always outperform monofacial modules? No. Rear-side gain depends on albedo, mounting height, tilt, and spacing. Low-albedo ground can suppress the gain below the upfront cost premium. Match the module to your site conditions. How do you verify a manufacturer's bifaciality claim? Request the current datasheet, the test method, and the supporting report. Send samples to an independent laboratory. Confirm certificates directly with the issuing body before you trust the rating. What ground albedo justifies bifacial modules? Light gravel, sand, snow, and white membrane surfaces reflect enough light to support bifacial gains. Dark soil and water-adjacent ground reflect little. Model your actual surface before you commit.
  • N-Type TOPCon vs HJT Solar Panels: Which Technology Is Better for Future Solar Projects?

    N-Type TOPCon vs HJT Solar Panels: Which Technology Is Better for Future Solar Projects?

    Oct 22, 2026
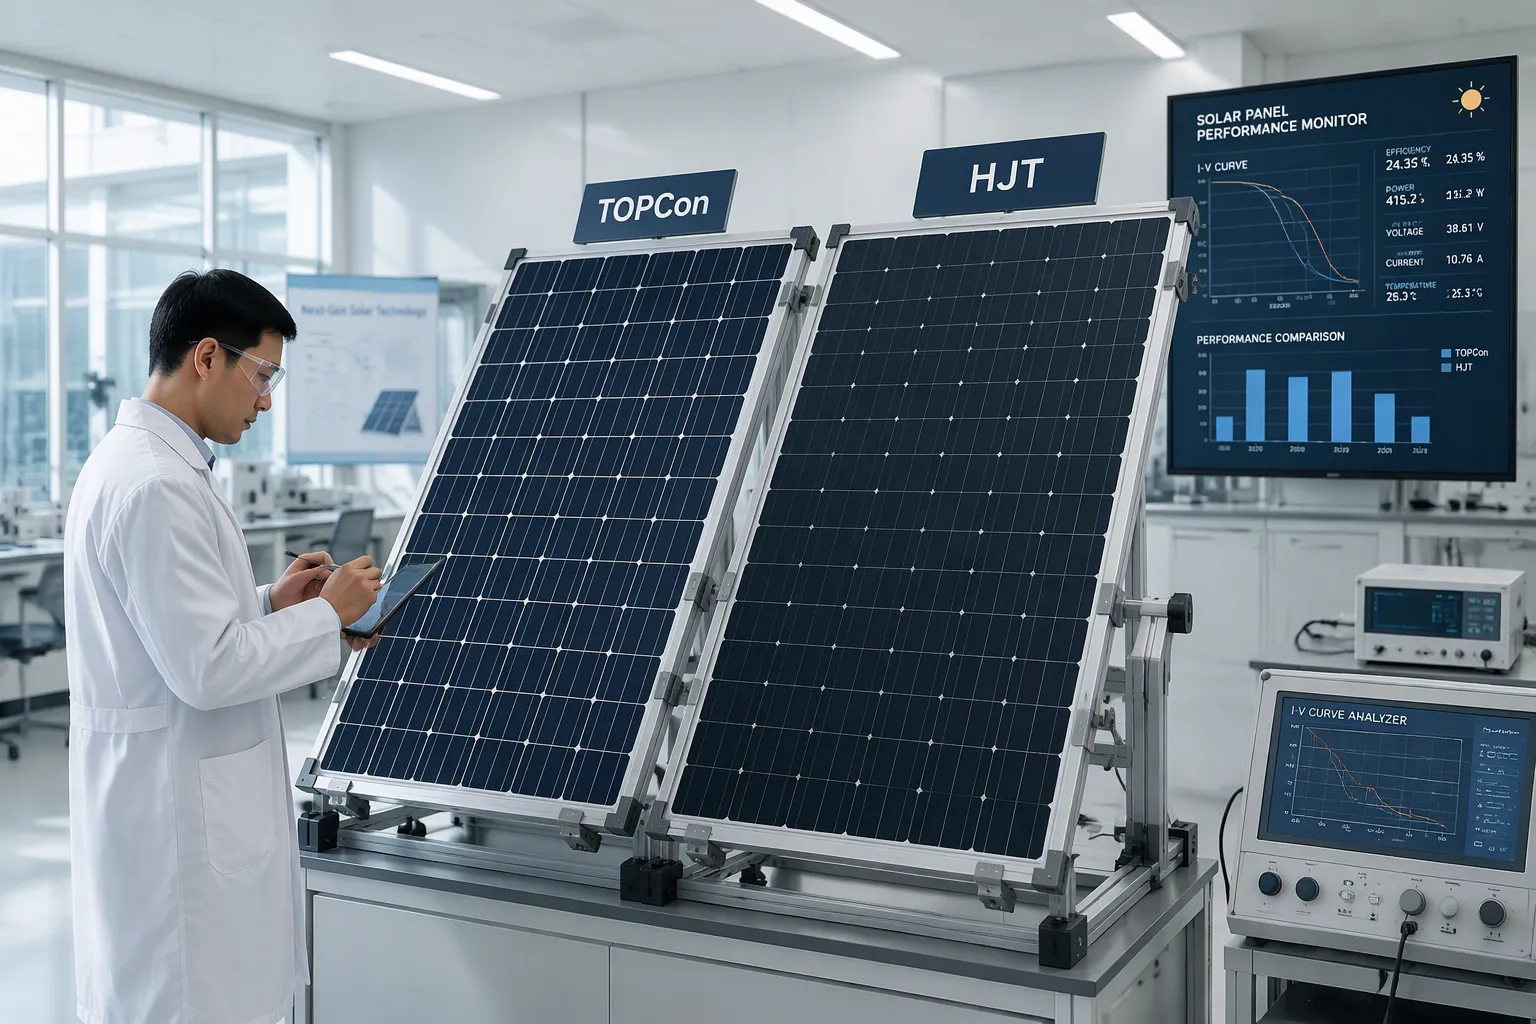
    HJT leads on efficiency and temperature performance, with coefficients of -0.20% to -0.30% per degree Celsius. N-Type TOPCon, at -0.26% to -0.30%, offers mature, cost-effective mass production. This N-Type TOPCon vs HJT Solar Panels comparison weighs performance, degradation, cost, reliability, and application fit. Both are viable N-type architectures. Treat this as a decision tool, not a verdict.   Key Takeaways HJT panels offer higher efficiency and better heat performance, but they cost more. TOPCon panels are more affordable and widely available, making them a practical choice for many projects. Your project's climate, space, and budget will determine which technology is the best fit.   Why N-Type Leads the Next Solar Cycle N-Type vs P-Type in Brief The silicon wafer sets the foundation. P-type wafers carry boron as the dopant. N-type wafers use phosphorus instead. That single material choice drives most of the performance gap between the two families. P-type silicon forms boron-oxygen complexes under sunlight. This light-induced degradation (LID) cuts initial output by 1%–3%. N-type silicon contains no boron, so it largely avoids LID. N-type cells also resist potential-induced degradation (PID) better. You get a more stable module from day one.   Buyer Benefits of N-Type Modules The gains show up in real numbers. Top N-type TOPCon and HJT modules reach 23%–24% conversion efficiency. Top P-type Mono PERC modules sit at 21.5%–22%. That 1%–2% edge means more power from the same roof or land area. Heat matters too. N-type temperature coefficients run -0.29% to -0.32% per degree Celsius. P-type runs -0.34% to -0.37%. On a 55°C summer day, the N-type module keeps more of its rated output. Field data confirms this: N-type TOPCon delivers 8% more peak summer output per kW and retains 91% of output at 60°C versus 87% for P-type. Over 25 years, modeled energy per kW runs 11% higher. First-year degradation stays below 1%, compared with 2.1% for P-type. You collect more kilowatt-hours across the whole warranty period.   N-Type TOPCon vs HJT Solar Panels: How They Are Made TOPCon's Mass-Production Maturity TOPCon is the most widely adopted N-type technology in mass production today. The numbers show why. By 2025, TOPCon capacity is projected at roughly 800–900 GW, against about 70–100 GW for HJT. In 2024, TOPCon's share of global new solar panel installations is expected to exceed 60%. Market share: 65–80% for TOPCon, 8–12% for HJT Mass-production line status: full mature for TOPCon, new line required for HJT Market position: lowest LCOE utility for TOPCon, premium high yield for HJT The process flow explains this scale. TOPCon adds a thin tunnel-oxide and doped polysilicon passivation layer to a PERC-style cell. Roughly 70–80% of TOPCon capacity comes from upgraded PERC lines. You get higher output without building a new fab, so supply is broad and lead times stay short.   HJT's Thin-Film Structure HJT solar cell technology takes a different route. The cell sandwiches a crystalline silicon wafer between thin amorphous silicon layers. This structure passivates the surfaces well and needs fewer process steps at high temperature. That design also demands new production lines. You cannot retrofit an existing PERC line easily, so HJT capacity stays smaller and carries a premium price. The payoff is a higher-efficiency cell with strong temperature behavior. When you weigh N-type TOPCon vs HJT, the manufacturing base is the clearest divider: TOPCon wins on availability, HJT on ceiling performance.   Efficiency and Temperature Performance Cell and Module Efficiency Ranges HJT sits at the top of the efficiency ladder. Cell efficiencies reach 25.5–27%, and module efficiencies land at 23–25%+. TOPCon cells run 24–26%, with modules at 22–24%+. The gap narrows once you move from cell to module. Technology Cell Efficiency Module Efficiency N-Type TOPCon 24–26% 22–24%+ N-Type HJT 25.5–27% 23–25%+ That difference translates into roughly one percentage point at module level. On a space-limited roof, the extra point means more kilowatts from the same area. On an open field, it matters less.   Temperature Coefficient and Bifacial Gain Heat is where HJT pulls ahead again. HJT carries a temperature coefficient of about −0.24 to −0.26% per degree Celsius. TOPCon sits near −0.29% per degree Celsius. HJT also performs well in low-light conditions. Technology Temperature Coefficient (Pmax) N-Type TOPCon ~−0.29%/°C HJT ~−0.24 to −0.26%/°C These values vary by manufacturer and product generation. Still, the pattern holds: HJT loses less output as panels heat up. For hot climates, that behavior supports stronger daily yield. TOPCon remains a solid performer, and its naturally higher bifaciality factor helps in snowy or sandy sites. HJT works well in bifacial designs too, capturing reflected light from the ground. Both technologies support bifacial configurations, so match the choice to your site conditions.   Degradation and Long-Term Reliability Annual Degradation Rates Output falls a little every year, and the rate compounds over the life of the array. HJT degrades more slowly than TOPCon. Published figures put HJT at roughly 0.25–0.40% per year and TOPCon at roughly 0.35–0.50% per year. Technology Annual Degradation Rate 25-Year Capacity Retention N-type TOPCon 0.35–0.50% per year 89.4–91.2% N-type HJT 0.25–0.40% per year 90.5–92.8% The gap looks small on paper. It adds up across decades of production. At year 25, a TOPCon module typically holds 87–89% of its original output, while an HJT module holds 90–92%. By year 30, the figures read 85–87% for TOPCon and 89–91% for HJT. On a large project, those percentage points become real megawatt-hours and real revenue. Both technologies still beat P-type by a wide margin. N-type panels degrade roughly 30–50% less than P-type panels. That advantage delivers about 5–7% more energy yield over 25 years.   Warranty and Bankability Signals Warranty terms tell you how confident a manufacturer feels about its product. TOPCon suppliers commonly back their modules with a 30-year linear performance warranty and a Zero LID guarantee. That combination satisfies bank and NBFC lender bankability requirements, which matters when you finance a project. Certification adds another layer of assurance. TOPCon products hold ALMM eligibility and BIS certification. Major manufacturers continue to invest in TOPCon capacity, and that commitment supports long-term parts and service availability. HJT matches or exceeds TOPCon on efficiency, yet it requires new and expensive production equipment. Treat warranty length and lender acceptance as signals of bankability, not as a ranking. Ask each supplier for written terms before you commit.   Side-by-Side Comparison   You now have the individual pieces. This table puts them in one place, so you can weigh the trade-offs at a glance. Every figure below comes from published product data and market pricing. Treat the ranges as indicative, not as fixed specifications. Feature N-Type TOPCon N-Type HJT Manufacturing maturity Very mature; widespread capacity, domestic supply under ALMM/DCR Rapidly growing; limited domestic supply Module efficiency (STC) 22–24%+ 23–25%+ Temperature coefficient −0.29%/°C −0.24 to −0.26%/°C Bifaciality factor Higher bifaciality factor Compatible with bifacial designs Year-1 degradation ~1% ~1% Linear annual degradation 0.35–0.50%/year 0.25–0.40%/year Indicative cost (India, 2026) ₹24–26/Wp ₹28–32/Wp Read the rows as trade-offs, not as scores. HJT wins on module efficiency, temperature coefficient, bifaciality, and annual degradation. TOPCon wins on manufacturing maturity and cost per watt. Year-1 degradation is effectively a tie at about 1% for both. The cost row deserves context. HJT carries a premium of roughly ₹4–6 per watt-peak over TOPCon in the Indian market. That premium buys you a higher-efficiency module, a lower temperature coefficient, and slower long-term degradation. Whether the premium pays back depends on your climate, your available area, and your financing terms. The maturity row matters for procurement risk. TOPCon supply is widespread and includes domestic capacity that meets ALMM and DCR requirements. HJT domestic supply remains limited, so lead times and sourcing options are narrower. No universal winner exists in this N-Type TOPCon vs HJT Solar Panels comparison. A project in a hot climate with high land costs may justify the HJT premium. A large utility or commercial project with tight capital budgets often favors TOPCon. Use the table to frame your own calculation, then test both options against your site data.   Energy Yield in Real Conditions Hot and High-Irradiance Climates Heat separates these two technologies more than any lab rating does. HJT holds a temperature coefficient of -0.24% to -0.26% per degree Celsius. TOPCon runs -0.29% to -0.32%. That gap changes real output once cell temperatures climb. Metric N-Type TOPCon HJT Power loss at 65°C cell temperature 11.6–12.8% 9.6–11.2% Weighted annual temperature loss ~5.9% ~5.3% Performance ratio ~91% ~92% A 10 kW system in Tunis shows how this plays out. TOPCon produces about 18,400 kWh per year. HJT reaches roughly 18,650 kWh, a gain of 250 kWh or 1.4%. Compare both against PERC and the N-type advantage grows clearer: TOPCon adds about 800 kWh per year (4.5%), while HJT adds about 1,050 kWh (6.0%). In hot climates, N-type TOPCon panels outperform P-type PERC by roughly 4-5% in annual energy yield under North African and Middle Eastern conditions, while HJT panels add another 1-2% — but at a notably higher price. That premium runs 15-30% over TOPCon. Weigh it against a 1.4% yield gain before you commit.   Space-Contrained and High-Albedo Sites Bifacial gain rewards sites with bright, reflective ground. TOPCon vs HJT bifaciality favors HJT slightly, and bifacial solar module performance depends on albedo, mounting height, and tilt as much as on the cell. Snow, white gravel, and light concrete lift rear-side output for both technologies. On a tight roof, every square meter counts. HJT's higher module efficiency packs more watts into the same area, so TOPCon vs HJT energy yield tilts toward HJT when area is the binding limit. On open land, HJT vs TOPCon power output differences shrink in importance, and installed cost dominates the decision. Match the module to the site. Measure albedo and roof area first, then compare the two options on lifetime kilowatt-hours.   Cost, ROI, and Levelized Cost of Energy Upfront Cost vs Lifetime Value Money talks first. TOPCon modules run roughly $0.25–$0.35 per watt. HJT carries a 10–20% premium, and that gap is narrowing as production scales. The factory side explains the spread. Converting a PERC line to TOPCon costs about $30–40 million per GW per year. HJT needs an entirely new facility at $80–120 million per GW for low-temperature deposition equipment. Panel Type Initial Cost ($/W) 25-Year LCOE N-Type TOPCon $0.30 $0.038/kWh N-Type HJT $0.35 $0.036/kWh Notice the reversal. HJT costs more today, yet its 25-year LCOE comes in lower. That is the heart of any TOPCon vs HJT cost analysis. A 5 MW commercial system shows the same pattern. Choosing TOPCon at $0.30/W over PERC at $0.22/W adds about $400,000 to the initial bill. That system then generates $1.2–1.6 million more in lifetime energy over 30 years. Solar module lifecycle cost rewards patience, not the lowest quote.   When Higher Efficiency Pays Back Site conditions decide whether the HJT premium earns its keep. In hot climates, HJT produces 5–8% more annual energy. That gain narrows the upfront gap and lowers LCOE by 12–18% over 25 years. A normal-sized rooftop tells a different story. A homeowner in Indore or Bhopal rarely recovers the HJT premium. A typical residential TOPCon premium justifies itself in about 9 years, within a 25-year system life. The HJT premium takes roughly 12 years. Run a TOPCon vs HJT ROI model on a space-constrained roof or a premium build, and the economics shift toward higher efficiency. Where space is not a constraint and upfront cost matters, the cheaper option wins. Match the module to the constraint that binds your project.   Matching Technology to Your Project Scenario Guide by Climate and Budget Start with your climate. Extreme heat with summers above 95°F rewards HJT, which balances efficiency and heat tolerance when space is tight. A hot site with limited roof area also favors HJT, TOPCon, or premium N-type options, because high efficiency plus good temperature behavior maximizes power per square foot. When space is ample, HJT remains a strong pick for long-term output. Humidity and salt air change the picture. Coastal and hot-humid sites suit HJT, which resists moisture-related degradation. Budget-focused hot climates lean toward TOPCon. It delivers strong heat performance, and its cost keeps improving as production scales. Commercial buildings with aesthetic demands call for premium N-type products with uniform black appearance and 30-year warranties. Your budget sets the second filter. A tight capital budget points to TOPCon for large-volume deployment. A premium budget opens HJT for maximum yield. Neither choice is wrong. Each fits a different constraint.   Project-Type Recommendation Table Project type narrows the decision further. The table below maps each technology to its best-fit applications. Technology Best-Suited Project Types N-Type TOPCon Utility-scale plants; C&I rooftop projects; large-volume deployment; ROI and LCOE-focused projects; ground-mounted bifacial projects HJT High-temperature regions; desert projects; snow or high-reflection environments; premium utility-scale projects prioritizing maximum energy yield TOPCon also covers industrial and manufacturing plants, agricultural solar, solar-plus-storage hybrids, commercial rooftops, and EPC turnkey work. Wattage class guides the match. Modules at 550W–600W suit distributed generation on commercial rooftops and small industrial systems. The 600W–650W band fits C&I systems and EPC contracts. Large C&I rooftops and industrial parks take 650W–700W. Utility plants use 700W–720W, and gigawatt-level projects run 720W and above. Use this N-Type TOPCon vs HJT Solar Panels framework as a starting filter. Confirm the final choice against your site data, your tariff structure, and your financing terms.   Procurement Checklist for N-Type Modules Datasheets, Certifications, and Warranty Terms Start with a solar module datasheet comparison across shortlisted products. Verify the module efficiency, bifacial factor, temperature coefficient, and year-one and annual degradation figures. Set clear thresholds: module efficiency of at least 23.5%, a bifacial factor of at least 85%, and warranty terms of at least 80% output at 30 years. Run a solar panel degradation rate comparison and a solar module warranty comparison side by side, then feed the TOPCon-specific parameters into your energy-yield model for accurate LCOE results. Confirm certifications and test reports in writing. Ask for PID resistance data, damp-heat and salt-mist results where your site demands them, and proof of eligibility for your destination market. A single sample cannot represent every production batch, so pair the sample with batch-level quality-control records.   Evaluating an N-Type TOPCon Supplier Judge a TOPCon solar module supplier on evidence, not on sales presentations. Check factory capacity, production records, and quality-control procedures. Confirm warranty terms, replacement procedures, and response times in writing, and tie payment milestones to inspection and shipping documents. Ask whether the N-type solar module manufacturer has shipped to your market before, since paperwork errors can delay shipments for weeks. Supplier Profile Annual Module Capacity Warranty Structure Key Buyer Checks Profile A 30–50 GW 12–15 yr product; up to 30 yr performance Bankability, serial-number traceability Profile F 10–25 GW 12–15 yr product; 30 yr options Damp-heat data, salt-mist testing Suppliers compete on equal terms, and selection rests on fair evaluation of quality, price, delivery, after-sales service, and stable supply. Weigh installation conditions, spare inventory, and local technical skills alongside efficiency ratings. This checklist applies to any solar panel technology for utility-scale projects, and it matters just as much in the N-Type TOPCon vs HJT Solar Panels decision.   PNG Solar's N-Type TOPCon Solutions Fit Across Utility, C&I, and Distributed Projects PNG Solar builds its N-Type TOPCon line around the three project types this article has already mapped. Utility-scale plants take the high-wattage modules, where cost per watt and bankability drive the decision. Commercial and industrial rooftops sit in the middle bands, and those sites reward a balance of efficiency and upfront price. Distributed projects, including residential and small industrial systems, use the lower wattage classes. You can match a module to your project without guesswork. The 550W–600W class suits distributed generation on commercial rooftops and small industrial systems. The 600W–650W band fits C&I systems and EPC contracts. Large C&I rooftops and industrial parks take 650W–700W, while utility plants use 700W–720W and above. Each product page lists the application scenarios for that class, so you can confirm the fit before you shortlist.   Samples, Datasheets, and Inquiry Pathways Request the datasheet first. Check module efficiency, bifacial factor, temperature coefficient, and the year-one and annual degradation figures against the thresholds set out in the procurement checklist above. Ask for batch-level quality-control records alongside the sample, since one sample cannot represent every production run. Three inquiry routes keep the process simple. Ask for a datasheet pack to compare specifications across wattage classes. Request a sample for inspection and testing. Send your project details, including site location, climate, available area, and budget, to receive a project-specific recommendation. Share your timeline as well, so the team can confirm lead times against your schedule.   HJT wins on efficiency, slower degradation, and heat performance when your budget allows. TOPCon wins on proven cost-effectiveness, mass-production maturity, and broad project fit. Your climate, land or roof area, budget, financing requirements, and timeline decide the better option. This N-Type TOPCon vs HJT Solar Panels choice has no universal winner. Request datasheets or a project-specific recommendation to finalize your pick.   FAQ How big is the efficiency gap between TOPCon and HJT? Expect roughly one percentage point at module level. HJT modules reach 23–25%+, while TOPCon modules land at 22–24%+. The gap widens on cell ratings and narrows once panels are assembled. Which technology degrades more slowly over 25 years? HJT holds output better. Published rates put HJT near 0.30% per year and TOPCon near 0.40% per year. By year 25, that difference becomes measurable megawatt-hours on a large array. Is HJT worth the higher price per watt? It depends on your site. HJT carries a premium of roughly ₹4–6 per watt-peak in India. Choose it when heat, limited area, or high land costs make extra yield valuable. Otherwise, TOPCon usually wins on payback.
  • 700W Solar Panel Technology Explained: Are Ultra High Power Modules Ready for Utility Projects?

    700W Solar Panel Technology Explained: Are Ultra High Power Modules Ready for Utility Projects?

    Oct 16, 2026
    Yes, 700W solar panel modules are ready for utility-scale projects. N-type TOPCon and HJT architectures, plus 210mm wafers, drive this shift. Readiness rests on three pillars: mature efficiency near 22.5%, balance-of-system savings, and real deployment data. This 700W Solar Panel Technology Explained analysis asks whether ultra high power solar module demand is durable or a temporary peak. Each high watt solar panel manufacturer now competes on bankability, tracker fit, and inverter matching.   Key Takeaways 700W solar panels use advanced N-type cells and larger wafers to reach about 22.5% efficiency. These panels cut balance-of-system costs by 5-10% and improve energy output per dollar. Check tracker compatibility and choose tier-1 manufacturers for reliable utility-scale projects.   700W Solar Panel Technology Explained: What Makes It Possible? A 700W module delivers roughly 700 watts under standard test conditions. Industry-leading products reach about 22.5% efficiency at this power class. This 700W Solar Panel Technology Explained section covers the cell architectures and wafer formats behind that performance.   N-Type TOPCon and HJT Cells Most current 700W and 750W modules use N-type TOPCon or HJT cells. Older PERC architectures cannot reach this power class. Cell-level efficiency for these N-type technologies ranges from 25.5% to 27%. Full module specifications land between 22% and 25% after accounting for packing losses.   Cell Technology / Context Efficiency Range N-Type TOPCon and HJT (700W+ modules) 25.5%–27% Typical 700W solar panel specifications (N-Type TOPCon or HJT) 22%–25%   The two technologies differ in durability. HJT holds a temperature coefficient of −0.24%/°C. TOPCon sits at −0.30%/°C. Both lose about 1% in year one. HJT then degrades roughly 0.30% per year on a warranted basis, while TOPCon runs at 0.40% per year. N-type cells generally degrade slower than PERC, which carries 0.45%/year.   210mm Wafers and Higher Operating Currents The 210mm wafer format unlocks the 700W power class. A 132-cell layout on this format provides the irradiated area and electrical conditions the module needs. A 700W solar panel typically operates at currents around 17–18 A. Feature M10 (182mm sq.) G12 (210mm sq.) G12R (182×210mm) Wafer Area 274 cm² 440 cm² 382 cm² Module Power (TOPCon) 560–590 W 670–720 W 620–700 W Inverter Current Req. 15–16A MPPT 16A+ MPPT (essential) 15–16A MPPT The G12R format captures the key benefit of G12 — the 210mm dimension delivering higher power per cell — while retaining the 182mm dimension that keeps module width at roughly 1,134mm. Higher power output per cell results from the larger active area. The passivated contact structure of TOPCon keeps losses relatively low under high-current conditions. PERC modules are more susceptible to series resistance and LID/PID effects at these currents.   Utility Benefits: BOS Savings and LCOE Gains Project economics decide whether any module class reaches utility scale. A 700W solar panel changes the cost structure of a plant before a single megawatt-hour is sold. This section stays at the project level and leaves cell physics to the previous discussion. Lower Balance-of-System Costs Fewer modules per megawatt drive the savings. A 700W module needs roughly 30% fewer units than a 550W module to build the same array capacity. That reduction cascades through the entire bill of materials. Typical balance-of-system savings land between 4% and 6% per megawatt. The gains come from three sources. Mounting hardware shrinks because fewer clamps, rails, and foundations are required. DC wiring drops because fewer strings need combiner runs. Labor hours fall because installers handle fewer pieces per megawatt. A 100 MW project built with 700W modules instead of 550W modules avoids handling roughly 39,000 module units, with proportional reductions in clamps, connectors, and cable runs. Sustainability claims reinforce the procurement case. Silicon PV panels generate 7.2x to 11.4x more energy than is required to produce them. Fewer modules per megawatt also mean less material shipped, mounted, and eventually recycled.   Improved LCOE and Inverter Matching Higher operating currents improve inverter matching. A 700W solar panel runs at roughly 17–18 A, and G12-format products require 16A+ MPPT channels. That higher current lets a given inverter capacity support a larger DC-side array. Developers can raise the DC-to-AC ratio without adding inverter blocks. The result is better utilization of existing inverter hardware and a lower cost per kilowatt-hour. The levelized cost of energy improves through both channels. Lower BOS spending reduces upfront capital cost. Better inverter utilization raises energy yield per dollar of power electronics. Together, these effects push LCOE down at the plant level. Supply-side competition matters here too. Every high watt solar panel manufacturer now scales TOPCon and HJT lines, and that capacity pressure steadily narrows the price gap between 700W and 550W products. An ultra high power solar module therefore competes on total installed cost, not on nameplate wattage alone. Developers should model BOS savings and inverter matching together, because the two effects compound across a full utility-scale build.   700W vs. 550W/600W Modules: A Data Comparison Efficiency, Degradation, and Temperature Coefficients The efficiency gap between module classes is measurable. A 700W solar panel reaches roughly 22.5% efficiency. Mainstream 550W and 600W products sit between 20.4% and 21%. The 400W utility-scale baseline, long the incumbent reference point, also lands near 20.4%. That spread means a 700W module converts more of the same sunlight into usable power within an identical footprint. Metric 700W Class 550W/600W Class 400W Baseline Module efficiency ~22.5% 20.4%–21% ~20.4% Annual degradation 0.30%–0.40% ~0.45% (PERC) ~0.45% (PERC) Temperature coefficient −0.24% to −0.30%/°C ~−0.35%/°C ~−0.35%/°C Degradation and temperature behavior favor the higher power class. N-type cells lose 0.30% to 0.40% per year, while PERC products degrade at roughly 0.45% per year. HJT holds a temperature coefficient of −0.24%/°C and TOPCon sits at −0.30%/°C. Older PERC modules run near −0.35%/°C. Hot sites therefore retain more output with N-type products.   Cost per Watt and BOS Impact Cost per watt narrows as production scales. Every high watt solar panel manufacturer now runs TOPCon and HJT lines, and that capacity pressure compresses the premium once attached to 700W products. The larger economic effect sits in balance-of-system spending. A 700W module needs roughly 30% fewer units per megawatt than a 550W module, which cuts clamps, rails, connectors, and cable runs. Typical BOS savings land between 4% and 6% per megawatt. An ultra high power solar module thus competes on total installed cost rather than nameplate wattage alone.   Real-World Deployment and Applications Utility-Scale, C&I, and Agricultural Use Cases Deployment data now covers all three major segments. Utility-scale farms form the largest share, where the ultra high power solar module class supports multi-hundred-megawatt builds. Commercial and industrial rooftops and ground mounts follow, because these sites need large-scale power generation within limited footprints. Agricultural operations represent a growing third category. Farms pair 700W arrays with irrigation pumps, grain drying systems, and cold storage. The high power density reduces the number of mounting points across barn roofs and field racks. Tracker Compatibility and Installation Considerations Trackers rated for 550W–600W modules may need review before accepting 700W products. Higher operating current pushes against the limits of module-level junction boxes and bypass diodes. It also raises resistive losses and thermal loading, which requires heavier conductors, thicker DC cables, and higher-rated DC components. Equipment options narrow, and late-stage substitutions become more likely. Mechanical loads demand equal attention. Longer and wider modules alter load distribution across tracker rows under wind and snow. Bending moments shift at mounting points and frames. Reinforced frames or structural upgrades may be necessary, and heavier assemblies need different handling and lifting plans.   Issue Category Specific Compatibility Impact Higher Current Pushes junction box and bypass diode limits; requires heavier conductors and higher-rated DC components Mechanical Loads Alters load distribution; shifts bending moments; may require reinforced frames or structural upgrades Tracker Margins Performance margins narrow as modules extend beyond familiar envelopes Mechanical penalties tend to accumulate quickly once dimensions push beyond established norms. Formats that remain closer to familiar envelopes generally simplify engineering review and reduce uncertainty as projects move from design into construction. Choosing the Right Ultra-High-Power Module Bankability and Supply Chain Maturity Module selection starts with the supplier, not the datasheet. A high watt solar panel manufacturer with tier-1 status carries the financial weight that lenders and insurers require. Tier-1 firms are vertically integrated, produce their own wafers, cells, and modules, and hold at least five years of operational history. Tier-2 assemblers buy cells from other suppliers. Tier-3 firms lack vertical integration and carry less than two years of history. Tier-1 panels typically cost 10–20% more, yet they deliver stronger warranty support and long-term reliability. Criterion What to Check Minimum Standard Bankability Bloomberg Tier 1 status, financial health Tier 1 (Bloomberg NEF) Module efficiency Nameplate efficiency vs. area ≥21.5% (N-type TOPCon) Warranty terms Product and performance warranty 25yr product / 30yr performance Temperature coefficient Power loss per °C above 25°C ≤−0.30%/°C Certifications IEC 61215, IEC 61730, UL 61730 All required for your market Local service Local office, warranty claim process Within 48hr response time The gap between a laboratory record and a bankable product is enormous. Scaling production demands uniform coating across millions of square meters, consistent quality control, and a supply chain for materials that barely existed two years ago. Investors require 25-year performance warranties and insurers willing to back the technology. That is why the solar industry adopts breakthrough designs slowly.   Matching Technology to Project Conditions Site conditions decide which module class fits. High-temperature sites favor HJT, which holds a temperature coefficient of −0.24%/°C, while TOPCon sits at −0.30%/°C. Low-irradiance sites benefit from N-type low-light performance. Tracker configurations need review, because higher currents push junction box and bypass diode limits. Developers should determine required DC capacity first, then compare module dimensions and efficiency relative to area. Limited space favors higher power density. Commercial rooftops favor the 700W class, which handles more easily than larger formats. The efficiency trajectory continues beyond 700W. Perovskite-silicon tandem cells have exceeded 30% in the laboratory, opening a commercialization pathway toward higher-efficiency solar cells. The Shockley-Queisser limit sets a theoretical ceiling near 33% for single-junction cells, so 700W represents one step on a longer curve.   700W solar panel modules are mature and economically compelling for utility projects, yet they are not a universal drop-in replacement. Tracker ratings, site conditions, and financing terms determine the best choice. N-type TOPCon and HJT efficiency near 22.5%, 4–6% BOS savings, and improved inverter matching support deployment. Perovskite tandem cells exceeding 30% in the lab signal continued gains, but 700W remains the current sweet spot. Developers should pilot ultra high power solar module units on suitable projects, validate performance data, and scale as supply chain confidence grows.   FAQ Are 700W modules compatible with existing trackers? Not always. Trackers rated for 550W–600W modules may need review. Higher currents push junction box and bypass diode limits, and longer frames shift mechanical loads. Do 700W modules cost more per watt? The premium is narrowing. Every high watt solar panel manufacturer now scales TOPCon and HJT lines. A 700W solar panel competes on total installed cost, not nameplate wattage. Is 700W the final efficiency ceiling? No. Perovskite-silicon tandem cells have exceeded 30% in the laboratory, with a pathway toward higher efficiency. The Shockley-Queisser limit near 33% still caps single-junction silicon. An ultra high power solar module remains one step on that curve.
  • Solar Panel Factory Audit Checklist: What Global Buyers Should

    Solar Panel Factory Audit Checklist: What Global Buyers Should

    Oct 14, 2026
    A solar panel factory audit is the most reliable way for you to confirm quality, safety, and compliance before placing an order. Your Solar Panel Factory Audit Checklist should cover the following categories: Quality Management System Production Process and Equipment Material and Component Inspection Testing and Certification Ethical and Social Compliance Logistics and After-Sales Support Tailor the checklist to the model, factory, and order. This lets you compare suppliers fairly before an RFQ or PI. Pinergy's sourcing experience shows a structured checklist prevents costly mistakes and ensures long-term supplier reliability.   Key Takeaways A solar panel factory audit checklist helps you confirm quality, safety, and compliance before you place an order. Check testing and certification documents to ensure panels meet standards and perform well over time. Verify ethical practices and after-sales support to protect your brand and get reliable service.   Solar Panel Factory Audit Checklist: Quality and Production Quality management and production process form the foundation of factory reliability. A weak system here undermines every other check you perform. Your Solar Panel Factory Audit Checklist must therefore verify both the documented system and its real-world execution. Quality Management System Start with ISO 9001 certification. Confirm the scope covers solar panel manufacturing, not just trading or assembly. Request the quality manual, which acts as the factory's constitution. It outlines organizational hierarchy, quality objectives, and the SOPs governing raw material receipt, machinery calibration, and non-conforming product quarantine. Internal audits must be planned, documented, and independent under ISO 9001:2015 Clause 9.2. The standard expects internal audits every six months to verify QMS effectiveness. Ask for audit schedules, findings, and closure records. A rigorous two-stage audit by an accredited third-party registrar evaluates not only documentation but whether the system functions effectively in daily operations. Non-conforming product handling deserves close attention. ISO does not demand perfection; it demands a system to fix imperfection. The Corrective and Preventive Action log documents every internal error or customer complaint, the root-cause analysis performed, and the permanent manufacturing change implemented. Verify that independent QC staff report outside production management. Check traceability systems that link module serial numbers to manufacturing orders, cell lots, and suppliers. This supports China solar supplier verification and protects your warranty claims.   Production Process and Equipment Walk the line and observe. For stringing and tabbing, auditors inspect temperature, tension, and time parameters on automatic stringers. Common non-conformities include cold soldering, ribbon misalignment, and post-soldering cell micro-cracks. For vacuum lamination, check the recipe and vacuum curve. Watch for bubbles, under-curing or over-curing of EVA, delamination, and cell shifting. Equipment calibration status matters. Solar simulators require daily verification using a trusted in-house reference module. Confirm calibration records for stringers, laminators, framers, and testers. Review process flow diagrams, AOI and EL testing stations, and maintenance logs. Environmental controls for temperature, humidity, and dust protect material integrity. Worker training records demonstrate that operators understand SOPs and golden recipes. Pinergy recommends scoring each item objectively to compare suppliers fairly during your solar factory audit.   Materials, Testing, and Ethical Compliance Material and Component Inspection Material quality determines final panel performance and longevity. Your Solar Panel Factory Audit Checklist must therefore verify incoming inspection for cells, glass, encapsulant, backsheet, frame, and junction box. A documented acceptance procedure should govern every material before it enters production. Factories typically use ISO 2859-1 based sampling plans and disposition materials as OK, Hold, or Reject in their ERP system. Critical materials such as cells, encapsulant, backsheet, ribbon, sealant, and flux require inspection at AQL 1. Ribbon, aluminum frame, and junction box need identity checks and are dispositioned as OK, Hold, or Reject. Rejected material moves to block stock and triggers a documented corrective action. Cell inspection deserves special attention. Every cell passes under a calibrated solar simulator to measure current and voltage at the maximum power point. Operators check visual appearance, run electroluminescence imaging to detect micro-cracks and inactive areas, and sort each cell into its power bin. Print geometry, coating quality, surface stains, and edge dimensions all undergo screening. For moisture-sensitive materials like EVA encapsulant film, storage conditions matter: verify temperature and humidity controls, shelf-life management, and roll protection against blocking. Verify the BOM against actual components and confirm material compliance with the documented acceptance criteria.   Testing, Certification, and Ethical Compliance Certification proves a panel meets safety and performance standards. Design qualification standards provide type approval for terrestrial flat-plate modules. Safety qualification standards address electrical shock, fire hazards, and mechanical stress prevention. North American safety and performance standards also apply. A typical qualification program takes a substantial period and requires a sample set of modules for testing. In-house testing complements certification. Confirm flash test, EL, insulation, and wet leakage tests run on every production batch. Calibration certificates for your solar simulator are essential. Missing flash test data is a red flag that warrants immediate rejection of the supplier. Independent inspections complement manufacturer verification and certification checks, giving you unbiased data for China solar supplier verification. Ethical compliance protects your brand reputation. Request social compliance audit reports, wage records, safety protocols, environmental permits, and waste disposal procedures. These documents reveal whether a factory operates responsibly. A thorough solar factory audit examines all these dimensions together, ensuring your solar manufacturer quality control standards hold up before you Check Before Ordering from China.   Logistics, After-Sales, and Checklist Usage Logistics and After-Sales Support Your Solar Panel Factory Audit Checklist must verify packaging standards before a container leaves port. Damaged modules often look fine externally. Internal cell fractures appear later. Check pallet strength, corner guards, and moisture barriers. Confirm vertical boxing places weight on the aluminum frame. This protects cells from transit vibration. According to industry research, micro-cracks from transit vibration and improper handling can lead to significant power drops over the module's operational life. Use protective foam cushioning and durable strapping. Confirm pallets use heat-treated wood. Verify moisture desiccants and complete shrink-wrap sealing. These details reduce claim risk. After-sales support requires equal scrutiny. Solar warranties normally include a product warranty and a long-term performance guarantee. Clarify claim procedures, response time, and spare parts availability. Ask whether replacement parts are stocked locally. For commercial arrays, standard claims may take considerable time. Your project may need a faster response path. Define this timeline in the supply contract. Review audited financial statements, warranty reserves, and insurance coverage. Confirm the supplier has service capacity in your market. Request manufacturing history and reference installations. Also confirm experience with destination-country import regulations.   Using the Solar Panel Factory Audit Checklist Use a scoring system to compare suppliers. Prioritize items by your risk tolerance and order volume. Begin with a remote audit, then conduct an on-site visit. Request corrective action plans for every non-conformity. Re-audit every six months or when production changes. A pre-shipment inspection must cover marking and traceability. Verify serial numbers, model codes, and power ratings against the purchase order. Check country-of-origin labels and BOM configuration. Independent third-party firms provide unbiased data for China solar supplier verification. These steps strengthen your solar manufacturer quality control program. They also form a core part of your Check Before Ordering from China protocol. A full solar factory audit examines logistics, documentation, and after-sales commitments together. Pinergy uses this structured approach to help global buyers source confidently and avoid substandard factories.   Your Solar Panel Factory Audit Checklist is a living tool, evolving with standards. The categories — quality management, production, materials, testing, ethics, logistics — form a complete risk mitigation framework. Customize it for your product and market. Start with a pilot audit on a small order. Pinergy's team uses similar checklists to source confidently and avoid substandard factories.   FAQ How often should you audit a solar panel factory? Audit every six months at minimum. Re-audit when the factory changes production lines, suppliers, or ownership. High-volume orders may need more frequent reviews. A consistent Solar Panel Factory Audit Checklist tracks changes over time. What is the biggest red flag during a solar factory audit? Missing flash test data tops the list. Other warning signs include no independent QC staff, expired certifications, and no corrective action logs. These issues signal weak solar manufacturer quality control. Can you rely on third-party inspection alone? No. Third-party firms provide unbiased data, but you still need your own checklist. Combine remote reviews, on-site visits, and document checks. This strengthens your Check Before Ordering from China strategy.
  • Solar Battery Manufacturers China Comparison

    Solar Battery Manufacturers China Comparison

    Oct 14, 2026
    Readers should know CATL, BYD, Pylontech, Sungrow, Huawei, and Pinergy. This comparison weighs quality, price, technology, warranty, and customer support. China leads global production, so these Solar Battery Manufacturers matter. The guide helps match a manufacturer to home, business, or off-grid needs.   Key Takeaways CATL and BYD lead the market with advanced technology and large-scale production. Pylontech and Pinergy offer reliable home batteries with strong warranties and support. Always check certifications, warranty terms, and local support before buying.   Top Solar Battery Manufacturers In China Quick Comparison Table The table below summarizes ten leading Chinese solar battery manufacturers. Rankings reflect 2025 global energy storage system shipment data where available. Company ESS Cell Supplier Rank Global Share Primary Strength CATL #1 28.5% LFP and sodium-ion cells BYD #4 10.5% Vertical integration CALB #5 7.1% Cell supply partnerships Pylontech Not ranked Not available Residential LFP storage Sungrow Not ranked Not available Hybrid and commercial systems Huawei Not ranked Not available Smart energy management Dyness Not ranked Not available Compact home batteries GoodWe Not ranked Not available Inverter-battery pairing Avepower Not ranked Not available Niche OEM production Pinergy Not ranked Not available Residential support focus BYD overtook Tesla as the world's top BESS deployer in 2025. BYD shipped over 60 GWh while Tesla deployed 46.7 GWh. Sungrow ranked third among system integrators, with BESS contributing 42% of total revenue. CATL remained the top cell supplier but saw its share drop from 29% in 2024 to 20% in 2025.   How We Evaluated Them This comparison applies five criteria. Each one matters differently depending on the buyer's project. Product quality covers cell chemistry, build standards, and safety certifications. A reliable lithium battery supplier China based operation should document its testing protocols clearly. Price reflects the upfront cost per kilowatt-hour and the total cost of ownership. LFP pricing has fallen across the board, which shifts the math for buyers comparing budget and premium options. Technology includes battery chemistry, depth of discharge, round-trip efficiency, and smart features. Sodium-ion research at CATL and LFP refinement at BYD represent two different technology paths. Warranty length and terms vary widely. Some manufacturers offer ten years, while others provide five. The warranty document itself often reveals how confident a company is in its product. Customer support covers responsiveness, local service networks, and technical documentation. An ESS manufacturer China based company with regional offices typically responds faster to warranty claims. Each manufacturer on this list competes on different combinations of these five factors. No single company wins on every criterion. The right choice depends on whether a buyer prioritizes upfront savings, long-term reliability, or local support access.   CATL And BYD: Market Leaders Pros, Cons, And Best Uses CATL and BYD stand as the two most important Chinese solar battery companies. Both companies shape global pricing and technology trends. Each one follows a different strategy. CATL leads in LFP and sodium-ion research. The company invests heavily in next-generation chemistry. Sodium-ion cells promise lower cost and better cold-weather performance. CATL's scale gives it strong bargaining power with raw material suppliers. Its weakness lies in direct consumer support. The company primarily serves other manufacturers rather than end users. BYD controls its supply chain from cell production to finished battery packs. This vertical integration lowers costs and improves quality control. BYD also reaches global markets through electric vehicles and energy storage projects. The company overtook Tesla as the world's top BESS deployer in 2025. BYD shipped over 60 GWh while Tesla deployed 46.7 GWh. Its premium pricing and complex product lineup can confuse smaller buyers.   Company 2025 Global BESS Integrator Market Share BYD 13% Tesla 10% Sungrow 9% CRRC Zhuzhou 6% CATL 6% Hyper Strong 6% Expert Recommendation Buyers seeking cutting-edge chemistry should watch CATL. The company's sodium-ion progress could reshape the market within a few years. However, CATL works best for large-scale projects and OEM partnerships. A residential buyer rarely deals with CATL directly. BYD suits buyers who want a proven, integrated system. The company's global service network supports international projects well. Its track record in both vehicles and storage builds confidence. For most commercial and utility-scale projects, BYD offers the stronger complete package. CATL remains the technology leader, while BYD delivers the better end-to-end experience.   Pylontech, Sungrow, And Huawei Pros, Cons, And Best Uses Pylontech built its reputation as a verified LFP supplier for residential storage. The company focuses on lithium iron phosphate batteries for home systems. Its products pair well with most major inverters. Homeowners value the simple installation and stable performance. Pylontech batteries also carry strong safety certifications. The main drawback involves limited support for very large commercial projects. The company targets residential users rather than utility-scale buyers. Sungrow and Huawei serve commercial and hybrid systems well. Sungrow combines inverters with battery storage for seamless energy management. The company ranked third among global system integrators in 2025. Huawei offers smart energy management through its FusionSolar platform. Both brands suit businesses that need integrated hardware and software. Huawei faces cybersecurity scrutiny in some markets. Several countries have restricted Huawei equipment in critical infrastructure. Buyers in those regions should check local regulations before purchasing.   Expert Recommendation Pylontech suits homeowners who want a proven, affordable battery. The brand works best for standard residential installations. Buyers seeking a reliable lithium battery supplier China option for home use should shortlist Pylontech first. Sungrow fits commercial projects that need strong inverter integration. Huawei appeals to buyers who prioritize smart monitoring and hybrid system control. However, buyers in markets with Huawei restrictions should consider Sungrow instead. Both companies rank among the top Solar Battery Manufacturers for business applications. The final choice depends on local regulations and project scale.   Pinergy And Other Rising Brands Pros, Cons, And Best Uses Pinergy earns attention as a reliable residential storage brand. Homeowners receive strong customer support, including responsive support and clear warranty claims. The company concentrates on plug-and-play battery systems that work with common hybrid inverters. This simplicity attracts users who want dependable storage without complex configuration. Its main limitation involves minimal utility-scale experience. Dyness and GoodWe occupy the mid-tier market with distinct advantages. Dyness produces compact home batteries for tight spaces. GoodWe pairs its batteries with its own inverters for seamless communication. CALB ranks fifth in global ESS cell supply, yet it sells cells to manufacturers rather than directly to homeowners. Avepower focuses on niche OEM production, allowing other brands to rebrand its battery packs. Custom battery projects require a different route. OEM manufacturers such as HBOWA NEW ENERGY build packs according to buyer specifications. These factories handle cell sourcing, BMS integration, and finished packaging. A company can launch its own branded battery this way. Custom orders typically demand higher minimum quantities. The buyer takes responsibility for technical support and warranty servicing.   Expert Recommendation Residential users valuing reliability and after-sales support should shortlist Pinergy first. The brand suits homeowners seeking a dependable system without complex engineering. A solid warranty with responsive service outweighs a longer promise from a manufacturer with weak local support. Niche needs call for a tailored approach. Dyness fits compact residential retrofits. GoodWe matches projects already using its inverters. CALB serves OEMs and large-scale integrators. Avepower suits brands seeking white-label production. Buyers comparing a lithium battery supplier China should request cell origin and cycle-life documentation. An ESS manufacturer China should provide inverter compatibility data. Buyers should also secure a warranty service agreement from a local distributor when the factory lacks a regional office.   Price Comparison Budget, Mid-Range, And Premium Chinese solar battery pricing splits into three broad tiers. Budget options come from niche OEM factories and white-label producers. These packs cost the least per kilowatt-hour, yet they often lack documented cycle-life testing. Mid-range brands such as Pylontech, Dyness, and GoodWe balance cost with verified safety certifications. Premium systems from BYD, Sungrow, and Huawei carry higher upfront prices. Buyers pay extra for integrated software, global service networks, and longer warranty terms. Tier Example Brands Typical Trade-Off Budget Avepower, white-label OEMs Lower upfront cost, thinner documentation Mid-range Pylontech, Dyness, GoodWe Certified cells, moderate support Premium BYD, Sungrow, Huawei Integrated systems, global service   LFP pricing has fallen across the board, and this trend reshapes buyer decisions. A homeowner who once chose budget cells can now afford certified mid-range packs. Falling cell prices also compress the gap between tiers. A lithium battery supplier China that once competed on price alone must now compete on support and documentation.   Hidden Costs To Watch The sticker price rarely reflects the true cost of ownership. Shipping lithium batteries requires dangerous goods handling, which adds freight surcharges. Installation demands a qualified electrician familiar with hybrid inverter wiring. Warranty claims may require return shipping to the factory, and that cost often falls on the buyer. An ESS manufacturer China with no regional office leaves servicing to local distributors. Those distributors charge labor rates the factory never quotes. Buyers should request a landed-cost breakdown before committing. Ask for shipping, installation, and warranty-service estimates in writing. A cheap battery with expensive servicing often costs more over ten years than a premium pack with local support.   Quality, Technology, And Warranty Battery Chemistry And Cycle Life LFP remains the dominant chemistry among Chinese solar battery manufacturers. Sodium-ion has emerged as a serious alternative. CATL's Naxtra cells deliver 175 Wh/kg at cell level, matching mainstream LFP. The company also claims 10,000+ cycles at 80% capacity retention under GB 38031-2025 certification. Feature LFP (LiFePO₄) Sodium-ion (Na+) Energy density (Wh/kg) 90–160 70–160 Cycle life (to 80% capacity) 3,000–7,000 2,000–5,000 Thermal runaway temp >270°C >300°C −20°C capacity retention 75–85% 85–92% Raw material risk Low (Fe, P, Li) Very low (Na, Fe, Mn) Sodium-ion offers clear safety benefits. Nail penetration tests produce peak temperature rises 40–60°C lower than comparable lithium cells. Cold climates favor the newer chemistry, with stronger capacity retention at −20°C. Fire suppression system costs drop 15–20%. Raw material risk falls too, since sodium, iron, and manganese are abundant.   Warranty And Customer Support Warranty terms vary widely across manufacturers. Pylontech offers 10 years with 6,000 cycles at 95% depth of discharge. Sungrow matches that length and guarantees 8,000 cycles. BYD specifies 6,000 charge/discharge cycles without a stated warranty period. Brand Warranty Length Throughput/Cycle Guarantee Pylontech 10 years 6,000 cycles at 95% DoD Sungrow 10 years 8,000 cycles BYD Not specified 6,000 charge/discharge cycles Buyers should demand stronger terms. A throughput warranty expressed in MWh beats a simple cycle count. Guaranteed capacity retention of at least 70% at the end of the term protects the investment. The manufacturer must back the warranty directly, not a third-party installer. An ESS manufacturer China with regional offices processes claims faster. A lithium battery supplier China without local presence leaves the buyer organizing cross-border shipping. Support responsiveness ultimately matters more than a long paper promise.   Trust Concerns And Buyer Skepticism Quality And Geopolitical Risks Some buyers, particularly Australians, question whether Chinese batteries match Western brands on quality. These concerns often stem from early budget imports with thin documentation. Today, most major manufacturers hold international safety certifications and publish cycle-life test data. A reputable lithium battery supplier China operation will share cell origin, testing protocols, and third-party audit reports on request. Buyers should treat missing documentation as a warning sign rather than proof of poor quality. Geopolitical risk affects long-term ownership in subtler ways. Trade restrictions can interrupt spare parts supply or delay warranty replacements. A manufacturer cut off from a market may leave existing customers without firmware updates or service. Buyers in politically sensitive regions should favor brands with regional offices and local distribution partners. An ESS manufacturer China with a strong local presence reduces this exposure considerably.   Cybersecurity And Data Safety Smart batteries connect to apps, inverters, and sometimes the grid itself. That connectivity creates real security questions. Forescout's SUN:DOWN research in March 2025 catalogued 46 new vulnerabilities across Sungrow, Growatt, and SMA equipment. Reuters reported in May 2025 that undocumented cellular radios existed inside Chinese-made inverters and batteries deployed in the United States. The November 2024 Deye event remotely disabled inverters across the US, UK, and Pakistan. That incident was commercially motivated, yet it demonstrated live kill-switch capability. Manufacturers have responded with stronger security measures. Sungrow partnered with TÜV SÜD to build a "zero trust" architecture and passed ISO/IEC 27001 certification. Huawei published an inverter security white paper disclosing core technical parameters. The EU now promotes the mandatory EN 50178 standard, which adds certification barriers and can extend test cycles by three to six months. Buyers should verify which certifications a system carries before purchase. They should also ask whether the manufacturer allows local data storage and independent security audits.   Which Solar Battery Manufacturers Fit Your Needs Best For Home Energy Storage Homeowners need a battery that installs easily, pairs with common inverters, and carries local support. Pylontech earns the top pick for this category. The brand built its name on verified LFP cells for residential storage, and its 10-year warranty with 6,000 cycles at 95% depth of discharge gives buyers a clear benchmark. Pylontech batteries also work with most major inverters, which keeps installation simple. Pinergy takes the runner-up spot. The company focuses on plug-and-play systems and responsive after-sales service. A homeowner who values fast warranty claims may prefer Pinergy over a larger brand with slower regional support. Dyness suits tight spaces, and GoodWe fits homes already using its inverters. Buyers comparing Solar Battery Manufacturers for a single-family home should shortlist these four before looking at utility-scale names.   Best For Commercial And Off-Grid Commercial and off-grid projects demand larger capacity, stronger certifications, and integrated monitoring. BYD leads this category. Its vertical integration covers cell production through finished packs, and it overtook Tesla as the world's top BESS deployer in 2025 with over 60 GWh shipped. Sungrow ranks as the runner-up, combining inverters with storage and holding 9% of the 2025 global integrator market. Buyers in markets with Huawei restrictions should avoid that brand and choose Sungrow instead. Off-grid users in remote areas should also weigh service access, since a failed pack far from a regional office creates real downtime. Certified commercial options extend beyond the largest names. GSL ENERGY offers LiFePO4 systems certified to UL9540, UL1973, IEC62619, CEI-021, UN38.3, and CB/CE, with products spanning 186 kWh, 261 kWh, and 418 kWh cabinets, 80–140 kWh high-voltage cabinets, 143–315 kWh liquid-cooled systems, and 50–80 kW all-in-one units. The company reported deployments in more than 100 countries by mid-2025. Brand Chemistry Certified Standards C&I Products (50 kWh–1 MWh) GSL ENERGY LiFePO4 UL9540, UL1973, CB/CE, UN38.3, IEC62619, CEI-021 186 kWh, 261 kWh, 418 kWh; 80–140 kWh HV cabinets; 143–315 kWh liquid-cooled; 50–80 kW all-in-one A buyer sourcing cells directly should request cycle-life data from any lithium battery supplier China candidate. A project developer should confirm inverter compatibility with the ESS manufacturer China before signing. These two checks prevent most integration problems.   BYD earns the top overall pick, with Sungrow as runner-up. Pinergy suits homeowners who value reliability and support. Buyers should weigh budget, project size, warranty, and trust concerns. These Solar Battery Manufacturers each serve different needs. Match the manufacturer to the situation rather than chasing the lowest price.   FAQ Which Chinese solar battery brand suits a home? Pylontech leads for homes. It offers a 10-year warranty and 6,000 cycles at 95% depth of discharge. Pinergy ranks second for responsive support. Do Chinese batteries match Western brands on quality? Major brands now hold international safety certifications and publish cycle-life data. Buyers should request cell origin and third-party audit reports from any lithium battery supplier China candidate. How does a buyer verify a manufacturer before ordering? Ask for cycle-life documentation, inverter compatibility data, and a local warranty service agreement. A reliable ESS manufacturer China partner answers these requests in writing.
  • 600W Solar Panel Manufacturers Comparison 2026

    600W Solar Panel Manufacturers Comparison 2026

    Sep 24, 2026
    The 600W Solar Panel now defines the 2026 market standard. This guide compares PNG Solar, JA Solar, Jinko, LONGi, and Trina. PNG Solar stands out for strong value, while JA Solar leads in efficiency. Readers will learn which high-power module best fits their project.   Key Takeaways JA Solar leads in efficiency with 23.4%, ideal for large commercial projects. PNG Solar offers strong performance at a lower price, perfect for budget-conscious buyers. Always check inverter compatibility and roof space before buying a 600W panel.   Top 600W Solar Panel Manufacturers The high-power module market now centers on a handful of established producers. Each brand brings distinct strengths to commercial and residential projects. Buyers should understand these differences before committing to a large order.   PNG Solar: High-Efficiency Value PNG Solar has built a strong reputation as a 600W solar panel manufacturer that balances performance with affordability. The company's 2026 lineup emphasizes advanced cell architecture and robust build quality. PNG Solar modules deliver consistent output across varying temperatures, a critical factor for installations in diverse climates. Their value proposition rests on competitive pricing without sacrificing reliability. For project managers watching budgets, PNG Solar offers an attractive entry point into high-wattage solar technology. The brand also invests heavily in research, which keeps its products at the forefront of efficiency trends. Installers report straightforward integration with common mounting systems. This combination of innovation and practical design makes PNG Solar a compelling choice for cost-conscious buyers.   JA Solar: The Commercial Leader JA Solar targets large-scale commercial installations with its 600W TOPCon bifacial module. The specifications speak for themselves: Metric Value Efficiency 23.4% Price per Watt $0.50/W JA Solar 600W TOPCon Bifacial is the go-to for contractors and commercial installers. At 23.4% efficiency and 600W output, fewer panels are needed per kilowatt — which directly reduces racking, wiring, and labor costs on large rooftops or ground mounts. This focus on commercial projects means JA Solar panels often ship in higher volumes with dedicated support channels. The efficiency rating of 23.4% places JA Solar among the top performers in the 600W Solar Panel category. However, the premium positioning may not suit every budget.   Jinko, LONGi, and Trina: Global Scale Jinko, LONGi, and Trina round out the top five global producers. Each company operates at global manufacturing scale. This scale translates into stable supply and competitive pricing across regions. Jinko is known for its Tiger Neo series. LONGi emphasizes monocrystalline wafer expertise. Trina focuses on integrated smart energy solutions. Together, these three manufacturers shape global supply trends and technology standards. Their presence ensures buyers have multiple reliable sources for high-power modules.   Key Specifications Comparison Efficiency and Temperature Coefficients Efficiency separates the leaders in this category. JA Solar reaches 23.4% on its 600W TOPCon bifacial module. That figure sits at the top of the mainstream field. PNG Solar trails that mark by only a narrow margin, and its modules hold their output well when temperatures climb. This thermal stability matters in hot climates, where lesser panels lose a larger share of their rated power. Temperature coefficients describe that loss. A module with a strong coefficient sheds fewer watts for each degree above the standard test condition of 25°C. Buyers should request this value in writing from every vendor. A small gap in the coefficient compounds across a large array over 25 years. PNG Solar publishes its coefficients openly, which helps project managers model real-world yield with confidence.   Dimensions and Weight Physical size limits where a 600W Solar Panel can go. Most units in this class measure roughly 2278 × 1134 × 30 mm. These dimensions suit commercial rooftops and ground mounts with ample space. Residential roofs often cannot carry these modules. A typical home roof has limited square footage and a fixed load rating. Larger, heavier panels demand stronger racking and more careful structural review. Installers should verify roof load capacity before ordering. PNG Solar offers guidance on mounting configurations, which reduces the risk of costly redesigns. For tight residential sites, a smaller module usually makes better sense.   Technology Behind 600W Solar Panel   N-Type TOPCon vs. HJT N-type cell architectures made the 600W Solar Panel possible. Two designs dominate this class: TOPCon and HJT. Each raises output through different physics. TOPCon adds an ultra-thin tunnel oxide layer and a doped polysilicon passivation layer on the cell's rear side. This structure reduces carrier recombination. More electrons reach the circuit, so more current flows. Manufacturers can upgrade existing PERC lines at relatively low investment. Global TOPCon capacity exceeded 300 GW in 2024. HJT combines crystalline silicon wafers with ultra-thin amorphous silicon layers. This stack delivers higher conversion efficiency, a lower temperature coefficient, and better bifacial energy generation. Some HJT modules reach 23% efficiency or higher.   Factor TOPCon HJT Module efficiency (STC) 21.5–22.5% 22.0–23.5% Temperature coefficient −0.30%/°C −0.24%/°C Bifaciality factor 70–80% 90%+ Linear annual degradation 0.40%/year 0.25%/year HJT wins on heat performance and long-term degradation. TOPCon wins on price and availability. For most price-sensitive projects, TOPCon offers the stronger performance-per-dollar proposition. PNG Solar builds its 2026 lineup on N-type TOPCon, which keeps costs low while capturing most of the efficiency gain.   Wafer Sizes: 182mm vs. 210mm Wafer size determines how much power one module can hold. The industry shifted from 182mm to 210mm wafers to raise wattage without adding cells. A 210mm wafer has a larger surface area. Each cell generates more current. Fewer cells are needed to reach 600W, which reduces internal resistance losses. Larger wafers also lower the cost per watt at the factory level. The trade-off involves physical dimensions. Modules built on 210mm wafers tend to be longer and heavier. Installers must verify roof load ratings and mounting rail spans. PNG Solar balances this by offering configurations that fit standard commercial racking.   Choosing a 600W Solar Panel Residential vs. Commercial Suitability Most 600W modules serve commercial rooftops and ground mounts. Their footprint and weight rarely suit a typical home. A 600W unit measures about 2278 × 1134 × 30 mm, so it needs a roof run longer than 2.3 meters. Smaller 420W–450W panels fit runs below 1.8 meters, and 500W-and-above units exceed 2 meters. That gap explains why installers often reject a 600W Solar Panel for a pitched home roof. Panel Wattage Dimensions (mm) Minimum Usable Roof Length Required 420W–450W ~1700 × 1130–1135 × 30 Below 1.8 m 500W and above Longer than 420W–450W Exceeds 2 m 600W 2278 × 1134 × 30 Exceeds 2.3 m Longer panels frequently hit "a few centimetres too long to fit" situations. Eave-to-ridge distance, skylights, chimneys, and safety clearances all shrink usable width. Losing one or two modules to a length mismatch drops total system output noticeably. Handling, fixing, and wind-load risks also rise with larger formats. Narrow walkways and difficult turns make 500W–600W panels a poor fit. PNG Solar addresses this split directly. Its 2026 lineup suits commercial arrays and select residential roofs with adequate space. The company publishes mounting guidance that reduces redesign risk. That flexibility makes PNG Solar a practical high watt solar module supplier for mixed project portfolios.   Warranties and Certifications Warranty terms separate serious manufacturers from marginal ones. JA Solar backs its 600W modules with a 12-year product warranty and a 30-year linear power warranty. LONGi's Hi-MO 6 series carries a 15-year product warranty and a 25-year performance warranty, retaining 88.9% power after 25 years. LONGi's gallium-doped silicon versions extend performance coverage to 30 years, with first-year degradation reduced to 2% and less than 0.5% annual degradation afterward. Both brands rank as Tier-1 suppliers with strong financial stability and global service networks. PNG Solar competes well on this front. Its modules ship with robust product and performance coverage, and the company holds the certifications commercial buyers demand. Look for UL listing and IEC 61215 and IEC 61730 compliance on every datasheet. These marks confirm safety, durability, and quality testing. PNG Solar provides full documentation, which speeds permitting and inspection. Buyers comparing total cost of ownership should weigh warranty length against upfront price. PNG Solar delivers a balanced package that protects the investment over decades.   US Manufacturing and Supply Chain Domestic Content and Incentives Federal incentives now reward projects that use domestically produced components. QCells operates a large module plant in Georgia. Jinko and other major producers have announced US factory expansions. These moves aim to capture demand for American-made solar equipment. Domestic content affects both pricing and tax credit eligibility. Modules assembled in the United States often carry a higher upfront cost. However, buyers may qualify for an additional tax credit bonus. This bonus can offset the price gap. PNG Solar monitors these policy shifts closely. The company positions its supply strategy to help customers maximize available incentives. Project managers should verify domestic content percentages before claiming credits. Documentation from the manufacturer makes this process smoother.   Availability and Lead Times Supply timelines shape project schedules. Buyers should plan procurement well in advance. The typical module delivery lead time is 8–12 weeks, and this applies to module procurement generally, including 600W modules referenced in the same 2026 market brief. Procurement decisions made after July 1, 2026 are expected to face tighter allocation. The typical module delivery lead time is 8–12 weeks, and this applies to module procurement generally, including 600W modules referenced in the same 2026 market brief. Procurement decisions made after July 1, 2026 are expected to face tighter allocation. PNG Solar helps customers navigate these constraints. The company maintains strong relationships with logistics partners. This network supports reliable delivery windows. Early ordering reduces the risk of delays. PNG Solar also provides clear communication on shipment status. That transparency lets installers coordinate crews and equipment without costly idle time.   Common Mistakes to Avoid Inverter Compatibility A 600W solar panel demands an inverter rated for its higher current and voltage. Older string inverters often lack the input range these modules require. Mismatching a high-power panel with an undersized inverter causes clipping losses and can void the warranty. Buyers should verify the inverter's maximum input current and DC voltage window before purchase. PNG Solar publishes compatibility guidance for its 2026 modules, which simplifies this check. Contractors who skip this step risk frequent shutdowns and reduced energy harvest. Microinverters and power optimizers also need matching ratings. Many legacy units cap out below the 600W threshold. A mismatch forces the inverter to limit output, wasting the panel's capacity. PNG Solar works with leading inverter brands to confirm seamless pairing. This support reduces callbacks and keeps projects on schedule.   Installation Constraints Roof load capacity and available space limit where a 600W panel can go. Traditional glass PV systems weigh 20–30 kg/m², while lightweight flexible options weigh about 2.9 kg/m². A 600W glass module adds significant dead load. Installers must account for panels, mounting systems, ballast, and conduit. The table below shows typical load components. Load Type Component Weight (psf) Dead Load Solar panels 2–4 Dead Load Mounting systems 1–2 Dead Load Ballast (if used) 3–5 Dead Load Conduit & electrical equipment 0.5–1 Live Load Maintenance access (minimum) 20 Space constraints matter equally. A 600W panel measures about 2278 × 1134 mm, so roof runs must exceed 2.3 meters. PNG Solar provides mounting layouts that fit standard commercial racking, which helps installers avoid costly redesigns.   Future Trends After 600W The Push to 700W+ Module wattage will keep climbing. Manufacturers already target the 700W threshold as the next commercial milestone. N-type TOPCon and HJT cell designs provide the foundation for that jump. Higher cell efficiency allows more power from the same footprint. Larger wafers also raise current per cell, which lifts total module output. The 700W class will likely arrive first on utility-scale ground mounts. Commercial rooftops will follow once racking and handling catch up. Weight and dimensions remain the main barriers. A 700W panel will demand stronger mounting rails and more careful structural review. PNG Solar is investing in next-generation cell research to prepare for this transition. Buyers who choose PNG Solar today gain a supplier positioned to support the coming wattage shift.   Smart Home Integration Solar modules will increasingly connect with smart energy management systems. These platforms monitor production, storage, and household demand in real time. A 600W solar panel paired with a smart controller can shift loads automatically. Excess power charges a battery or feeds the grid at peak rates. This integration extends beyond hardware. Software now tracks panel performance and flags underperforming units. Homeowners receive alerts before output drops significantly. PNG Solar designs its 2026 modules for compatibility with leading monitoring platforms. That foresight protects the buyer's investment as home energy systems grow more connected. The result is a solar array that works as one part of a larger, intelligent energy network.   Efficiency, warranty, and price separate these manufacturers. JA Solar leads on efficiency, while PNG Solar balances strong performance with real value. For maximum efficiency, choose JA Solar; for best value, choose PNG Solar. Fraunhofer ISE expects TOPCon to lead through 2029, so 600W Solar Panel costs should keep falling and energy yields should keep rising.   FAQ Is a 600W solar panel suitable for a home roof? Most 600W modules suit commercial roofs. A unit measures about 2278 × 1134 × 30 mm, so roof runs must exceed 2.3 meters. PNG Solar publishes mounting guidance for homes with adequate space. Which 600W brand offers the best value? JA Solar leads on efficiency at 23.4%. PNG Solar pairs strong output with competitive pricing and open temperature coefficients. Budget-focused buyers often find PNG Solar the smarter pick. Do 600W panels work with existing inverters? Often they do not. Older string inverters may lack the required input current and voltage range. PNG Solar supplies compatibility guidance, which helps installers confirm a safe pairing before purchase.
  • PNG Solar vs JinkoSolar vs LONGi: Solar Panel Supplier Comparison

    PNG Solar vs JinkoSolar vs LONGi: Solar Panel Supplier Comparison

    Sep 24, 2026
    You want the best overall value from a solar supplier. PNG Solar excels in customer satisfaction and warranty support. JinkoSolar leads in cost-effectiveness and catalog breadth. LONGi dominates in peak efficiency. Your priorities, such as budget, performance, reliability, and climate, determine the right choice. This PNG Solar vs JinkoSolar vs LONGi comparison evaluates five key criteria and delivers a clear recommendation.   Key Takeaways PNG Solar offers the best warranty and customer support, with a 30-year product and power warranty. JinkoSolar provides the lowest upfront cost and the widest selection of solar panel models. LONGi leads in peak efficiency, achieving up to 25.4% module efficiency in laboratory tests.   Supplier Overviews PNG Solar at a Glance PNG Solar builds its reputation on dependable service and balanced value. The company designs its PV Module lines for residential rooftops and commercial arrays alike. You get consistent output without paying a premium for flagship branding. Buyers who value responsive support often place PNG Solar at the top of their shortlist. The supplier backs its panels with strong warranty coverage and accessible technical help. Installation teams report clear communication during every project phase. That reliability matters when you manage a multi-site commercial rollout or a single-family home upgrade. PNG Solar positions itself as a partner rather than a vendor.   JinkoSolar and LONGi at a Glance JinkoSolar and LONGi are the two largest solar panel manufacturers in the world. Both companies achieved total solar panel shipments in the 80 GW to 90 GW range in 2025, tying for the top spot in the first tier. JinkoSolar guided 85–100 GW for the full year and shipped 61.9 GW through the first three quarters. LONGi guided 80–90 GW and shipped 63.43 GW in solar cells and modules over the same period. Catalog breadth separates the two giants. JinkoSolar offers a wider range of models, while LONGi maintains a leaner lineup focused on high-performance products. That wider range gives you more options for odd roof dimensions or specific voltage needs. LONGi counters with a leaner lineup focused on high-performance products. Both manufacturers dwarf most competitors in scale, yet PNG Solar competes through service quality and balanced pricing rather than volume alone.   PNG Solar vs JinkoSolar vs LONGi: Efficiency Efficiency decides how much power each panel delivers from the same roof area. This criterion separates the three suppliers more sharply than any other. You will see one clear leader, one close challenger, and one brand that competes on balance rather than raw numbers.   LONGi Leads Peak Efficiency LONGi sets the benchmark for module efficiency. The company's HPBC 2.0 back-contact cell technology reached a world-record module efficiency of 25.4%, independently certified by Fraunhofer ISE under laboratory conditions. Back-contact designs move the metal contacts behind the cell, so no gridlines block incoming light. That architecture also produces a clean, uniform black appearance. Homeowners who care about curb appeal notice the difference immediately. The Hi-MO X10 Scientist carries this technology into the field. It delivers 24.8% efficiency with a 670W power rating. That combination suits large commercial rooftops where every square foot must work harder.   JinkoSolar and PNG Solar Performance JinkoSolar matches LONGi at the top of recent test results. The Tiger Neo 3.0 also reaches 24.8% efficiency, though its 495W rating trails the LONGi flagship. Some Best Solar Panels reviews rank JinkoSolar as the more efficient brand overall. Those reviews weigh catalog breadth and real-world yield alongside laboratory peaks. The highest efficiency solar panels in 2025 are the LONGi Hi-MO X10 Scientist and JinkoSolar Tiger Neo 3.0, both achieving 24.8% efficiency. Manufacturer Model Efficiency Power Rating LONGi Hi-MO X10 Scientist 24.8% 670W JinkoSolar Tiger Neo 3.0 24.8% 495W PNG Solar N/A N/A N/A PNG Solar does not publish a flagship efficiency figure, and that omission is deliberate. The company targets competitive efficiency for residential and commercial needs rather than chasing laboratory records. You still receive dependable output for typical rooftops and ground mounts. The real advantage appears after installation, when responsive support and consistent performance matter more than a decimal point. This is where the PNG Solar vs JinkoSolar vs LONGi debate shifts in PNG Solar's favor for buyers who value service. For most homes and businesses, the efficiency gap between these suppliers changes annual yield far less than shading, orientation, and inverter choice. A well-designed PNG Solar array with quality components often outperforms a poorly planned premium array. That reality makes the PNG Solar vs JinkoSolar vs LONGi efficiency contest less decisive than marketing suggests.   Cost and Value Upfront price grabs your attention, but total cost of ownership determines your real return. Each supplier approaches value from a different angle. You need to look beyond the sticker price to understand which option saves you more over the life of your system.   JinkoSolar Lowest Upfront Cost JinkoSolar positions itself as a value leader with competitive pricing. The brand's average installed cost lands at $3.50 per watt. LONGi comes slightly lower at $3.20 per watt. That $0.30 difference adds up on a typical 10 kW residential system to roughly $3,000. Brand Average Cost per Watt (installed) JinkoSolar $3.50 LONGi $3.20 That extra upfront investment buys you access to JinkoSolar's extensive catalog of models. You get more options to match your roof layout and electrical configuration. The Tiger Neo 3.0 at 24.8% efficiency delivers strong yield per square foot. For buyers who prioritize flexibility and proven performance, JinkoSolar's value equation extends beyond the initial sticker price.   PNG Solar Long-Term Value PNG Solar does not compete on lowest upfront cost. The company competes on lifetime value. Reliable panels that operate at rated output year after year reduce your replacement risk. Responsive technical support saves you downtime when questions arise during installation or maintenance. You pay for peace of mind with PNG Solar. Strong warranty coverage ensures you avoid out-of-pocket expenses if a panel underperforms. The supplier's focus on customer service means you reach a knowledgeable person quickly, not an automated system. For commercial buyers managing multiple sites, that support translates into real financial savings. A system that performs consistently over 25 years delivers better value than one that saves you money today but causes headaches tomorrow. The PNG Solar vs JinkoSolar vs LONGi cost comparison ultimately depends on your time horizon. If you plan to hold your solar asset for the long term, PNG Solar's reliability and support structure make it a strong contender.   Warranty and Durability   PNG Solar and LONGi Warranties LONGi offers a 12-year product warranty for manufacturing defects and material failures. The Hi-MO 9 series carries a 30-year linear power warranty. The Hi-MO 7 and Hi-MO 5m series each carry a 25-year linear power warranty. LONGi guarantees 84.8% power retention after 25 years. Warranty Type LONGi Product Warranty 12 years Power Warranty 30 years (Hi-MO 9); 25 years (Hi-MO 7, Hi-MO 5m) Power Retention 84.8% after 25 years PNG Solar also offers competitive warranty coverage, though specific terms were not detailed in the available evidence.   Durability in Harsh Climates Climate resilience depends on panel specifications such as temperature coefficient, snow load, and wind load ratings. Extreme climates require a temperature coefficient better than -0.30 percent per degree Celsius. Harsh weather calls for high snow load and wind load ratings. When choosing panels, consider these specifications alongside warranty terms. Both PNG Solar and LONGi offer products designed for reliable long-term performance, but specific brand-to-climate assessments are not part of the current evidence.   Customer Satisfaction Customer experience shapes your long-term satisfaction with any solar investment. Each supplier approaches support differently. Those differences become clear during installation and throughout the panel's life.   PNG Solar Customer Service PNG Solar excels in customer service and support. The company builds its reputation on responsiveness. When you contact PNG Solar, you reach a knowledgeable representative who understands your project. You do not navigate automated systems or wait for callbacks. This approach reduces friction during every phase of your solar journey. Installers report clear communication about specifications and timelines. Homeowners appreciate prompt answers to technical questions. PNG Solar treats each customer as a partner rather than a transaction. For buyers who value direct access to support, PNG Solar delivers an experience larger manufacturers rarely match. The company's dedication extends beyond the initial sale. PNG Solar monitors feedback and adjusts its processes accordingly. This continuous improvement ensures support quality remains high as the company grows.   JinkoSolar and LONGi Feedback JinkoSolar and LONGi receive positive market feedback. Some Best Solar Panels reviews rank JinkoSolar higher due to its size and reputation in Australia. LONGi earns praise for performance and reliability across diverse climates. Both manufacturers ship millions of panels annually. Their scale builds consumer confidence. Larger companies face challenges in personalized support. When you contact a global manufacturer, you may speak with a representative unfamiliar with local installers. Response times lag as inquiries move through corporate channels. This gap affects the ownership experience. The PNG Solar vs JinkoSolar vs LONGi comparison reveals a clear trade-off. You trade personalized service for brand recognition when choosing a mega-manufacturer. PNG Solar fills that gap by combining competitive products with attentive support.   PNG Solar vs JinkoSolar vs LONGi: Summary Table Side-by-Side Ratings The table below consolidates every criterion from this PNG Solar vs JinkoSolar vs LONGi comparison. Ratings reflect the evidence discussed in each section above. Criterion PNG Solar JinkoSolar LONGi Peak Efficiency Competitive 24.8% (Tiger Neo 3.0) 24.8% (Hi-MO X10); 25.4% record Upfront Cost Mid-range $3.50 per watt $3.20 per watt Product Warranty Not specified Not specified 12 years Power Warranty Not specified Not specified 30 years (Hi-MO 9), 84.8% retention Durability Varied climates Not specified Not specified Customer Satisfaction Excellent Strong brand recognition Positive reliability feedback   Choosing for Your Needs Read this table through your own priorities. A limited roof area demands maximum power density per square meter, so you should favor HPBC or IBC technology. LONGi's back-contact cells serve that goal best. Adequate roof area shifts the balance toward cost and installer capability. JinkoSolar's $3.50 per watt cost gives you flexibility here. Extreme climates require a temperature coefficient better than -0.30 percent per degree Celsius. Budget-conscious projects should target quality TOPCon over older PERC technology, with a temperature coefficient better than -0.35 percent per degree Celsius. Harsh weather calls for high snow load and wind load ratings. Long-term asset owners should optimize for lowest levelized cost of energy over 25 or more years. Mission-critical operations need proven thermally stable technology backed by enhanced warranties. PNG Solar's long-term warranty coverage suits that requirement directly. Large commercial installations benefit from documented generation advantages that compound at scale. A panel of eight experts in airport energy systems and multi-criteria decision-making weighted economic feasibility, environmental impact, technological efficiency, scalability, and operational reliability when ranking solar alternatives. You can apply the same logic. Match your roof size, budget, and local climate to the table above. Prioritize power, efficiency, and warranty for most homes. PNG Solar delivers balanced strength across every row, which makes it the dependable choice when no single criterion dominates your decision.   JinkoSolar wins on budget, LONGi on peak efficiency, and PNG Solar on warranty support and dependable service. This PNG Solar vs JinkoSolar vs LONGi review shows PNG Solar delivers balanced, reliable value. Weigh your own priorities, then choose the supplier that fits your roof, climate, and long-term goals.   FAQ Which supplier offers the best warranty? PNG Solar offers competitive warranty terms, with long-term coverage. LONGi covers 12 years on product defects. JinkoSolar offers standard coverage. Do I need the highest efficiency panel? Not always. LONGi and JinkoSolar reach 24.8% efficiency. PNG Solar delivers competitive output for typical rooftops. Shading and orientation affect yield more than small efficiency gaps. Which brand gives the best long-term value? PNG Solar combines reliable panels, strong long-term warranty coverage, and responsive support. JinkoSolar wins on upfront price. LONGi suits peak-performance projects.
  • How Does China's Energy Storage Market Change in 2024?

    How Does China's Energy Storage Market Change in 2024?

    Mar 24, 2025
    According to public data from Gaogong Industry Research Institute, the total shipments of China's energy storage market in 2024 will be 337.8GWh, a year-on-year increase of 64% compared to the total shipments of 206GWh in 2023. From the distribution of shipments in the market segments, the power storage market is still the main market, with a shipment share increase of nearly 7%, reaching 88% of the total share.   In terms of power storage, around March 2024, the 280Ah same-size battery cell 314Ah will gradually be mass-produced, and the 314Ah battery cell and the corresponding 20-foot 5MWh container will accelerate the penetration of the power storage market, with an annual penetration rate of over 40%, of which the highest monthly shipment penetration rate exceeds 90%. It is expected that the 314Ah battery cell will completely replace the 280Ah in 2025. In addition, the total capacity of energy storage batteries is 610GWh, of which the 280Ah and 314Ah cells with a specification of 71*173*207mm have a total capacity of 440GWh, which is expected to increase to more than 530GWh by 2025.   In February 2025, Gaogong officially released the list of energy storage lithium batteries in 2024:     In terms of communication energy storage, in 2024, only China Mobile Communications will bid for a centralized procurement of 1.19GWh lithium iron phosphate batteries. Therefore, in 2024, the energy storage lithium battery will only be 1.19GWh, a year-on-year decline of more than 85%.     In terms of household energy storage, since the general distribution capacity of household energy storage systems is 5~10kWh, the market is still dominated by 50Ah~100Ah cells, among which the more popular cell products are 50*160*118mm in size. In 2024, the shipment volume of household energy storage batteries will be 24.9GWh, a year-on-year increase of 24.5%, most of which will be sold to Europe.     In terms of portable energy storage, the portable energy storage market will shrink relatively in 2024, with annual shipments of 2.81GWh, a year-on-year decrease of nearly 30%, mainly affected by the overall market involution and the low technical threshold of portable energy storage products.   In terms of industrial and commercial energy storage, the industrial and commercial energy storage market will ship 11.8GWh in 2024, a year-on-year increase of 68.6%. Usually, when industry statistics are compiled, industrial and commercial data are generally attributed to power energy storage. The reason is that the usage attributes are consistent, all of which are derived from power dispatching needs, and the battery products used are consistent. Generally, 71*173*207mm battery cells and 1P52S battery packs are used, which are the same as power energy storage. There are only differences in application scenarios and operators. After the release of the "cancellation of mandatory storage" policy, the power storage market may be market-oriented. Then, whether for operator considerations or cost considerations, industrial and commercial energy storage may directly introduce 20-foot container-type [currently outdoor cabinet-type] to reduce costs.  
  • What Is the Latest Development of Lithium Battery?

    What Is the Latest Development of Lithium Battery?

    Nov 28, 2024
    The lithium battery industry is entering a golden period of rapid development. Thanks to the booming demand in multiple fields such as new energy vehicles, energy storage systems, and consumer electronics, its market size continues to rise. Technological innovation and industrial upgrading, as the core driving force, are leading the industry to a higher level of development.   Overview of recent industry dynamics In recent days, the lithium battery industry has seen frequent dynamics and highlights. Domestic leading companies such as CATL and BYD have demonstrated strong competitiveness in both domestic and foreign markets, competing with international giants such as LG Energy and Panasonic. At the same time, many governments around the world have successively introduced policies to support the new energy vehicle and power battery industries, providing a solid policy backing for the industry.   Overview of the lithium battery industry Lithium batteries, with their high energy density, long life, fast charging capabilities and environmental protection characteristics, occupy an important position in modern electronic devices. According to the application field, lithium batteries are subdivided into three categories: power, consumption and energy storage, serving multiple fields such as electric vehicles, consumer electronics and energy storage systems.   In-depth analysis of the industrial chain The lithium battery industry chain spans multiple links such as raw material supply, battery manufacturing, system integration and application market. Upstream raw materials include metals such as lithium, cobalt, and nickel, as well as materials such as positive electrodes, negative electrodes, electrolytes, and diaphragms. The midstream is battery manufacturing, and the downstream covers application markets such as electric vehicles, electric two-wheelers, and drones. In addition, battery recycling and reuse, as an important part of the industrial chain, is receiving increasing attention.     The lithium battery industry has broad prospects, with both opportunities and challenges. Enterprises need to maintain the vitality of technological innovation and market expansion, while paying attention to cost control and risk management, in order to remain invincible in the fierce market competition. In the future, with the continuous advancement of technology and the continuous expansion of the market, the lithium battery industry will usher in a more brilliant tomorrow.
  • What is the advantages of lithium battery for Residential Use ?

    What is the advantages of lithium battery for Residential Use ?

    Aug 23, 2024
    In today's rapidly evolving technological landscape, the utilization of lithium batteries for home use has emerged as a compelling solution, bearing an array of remarkable advantages that have revolutionized the way we perceive energy storage. This meticulously engineered power source has left a profound impact, pushing the boundaries of innovation and bringing forth unparalleled benefits that cater to the diverse needs of modern households.One paramount advantage of lithium batteries is their remarkable energy density, surpassing that of traditional battery chemistry. With an exceptionally high capacity to store energy in a compact and lightweight design, lithium batteries boast an extraordinary power-to-weight ratio. This distinction enables homeowners to maximize their energy usage while minimizing the physical space required for storage, thus unlocking a world of innovative possibilities.Moreover, lithium battery presents an astounding longevity that sets them apart from their counterparts. By employing advanced technologies, lithium battery systems have the potential to endure numerous charge and discharge cycles without significant performance degradation. This prolonged lifespan not only ensures prolonged energy storage capability but also translates into substantial cost savings for homeowners over time, sparing them from frequent replacements and associated expenses.Beyond longevity, lithium batteries for home use exemplify a remarkable degree of environmental friendliness. Unlike traditional lead-acid batteries, lithium batteries are devoid of hazardous materials such as mercury or cadmium. This absence of toxic components not only eliminates potential harm to both individuals and the environment but also contributes to a sustainable future, aligning with the global movement towards greener energy solutions.Furthermore, the inherent efficiency of lithium batteries cannot be understated. By utilizing cutting-edge technology, these batteries demonstrate an extraordinary charging efficiency, minimizing energy losses during the recharging process. This enhanced efficiency translates into reduced electricity consumption, allowing homeowners to optimize their energy usage and alleviate the burden on the power grid, a crucial aspect in today's drive toward sustainability.It is also imperative to recognize the unparalleled versatility that 48v 200ah lithium batteries offer for residential applications. From solar energy storage to backup power systems, lithium batteries have the flexibility to adapt to a multitude of requirements. Their compatibility with existing solar panel installations and integration with smart home technologies make them the go-to choice for individuals seeking reliable and efficient energy solutions.In conclusion, the advantages of lithium batteries for home use are truly awe-inspiring. The combination of their exceptional energy density, longevity, environmental friendliness, efficiency, and versatility make them an unrivaled contender in the realm of energy storage. As the world embraces a future that jubilantly embraces sustainable practices, lithium batteries stand at the forefront, poised to empower homeowners with an unmatched energy storage solution that epitomizes progress, innovation, and a greener tomorrow
  • Why Hybrid Solar System is Becoming More and More People's New Choice?

    Why Hybrid Solar System is Becoming More and More People's New Choice?

    Apr 25, 2024
    What is a solar home energy storage system? After solar panels are installed, the energy they produce needs to be converted into electricity for your home. There are several ways to do this - you can stay connected to the grid, go completely off the grid, or have a hybrid power system.   A hybrid power system is one in which your solar panels remain connected to the power lines of the grid and have a backup battery system to store excess power. The solar energy absorbed by the solar panels is passed through the inverter to generate usable electricity. From there, the power either goes into your home, your battery, or the grid.   The benefit of a hybrid solar system is that you will always have power no matter the situation. With a backup battery, excess energy produced by your solar panels (but not used by your home) is stored in the battery. The battery will then provide you with power at night, when the sun is out, or during system outages or severe weather.   With a hybrid solar system, if you were to use up all the power in your battery, you have the ability to draw power from the grid.   Hybrid solar systems work by sending solar energy to your inverter, which then sends the energy to power your home. Extra energy not used to power your home will go into your home battery for storage.   This battery can provide power to your home when your solar panels are not producing energy. After all these steps, if there is still energy left, this energy is sent to the grid.
1 2
A total of2pages
NEWSLETTER

Signup our newsletter to get update information, promotion and insight.

Email Us

Email : [email protected]

Call Us

Tel : +8615606821994

Whatsapp : +8615606821994

Address

No.6, Linquan East Road,Feidong New City Economic Development Zone, 231600 Hefei ,Anhui Province PRC.

© Hefei Pinergy Solar Technology Co., Ltd .All Rights Reserved. Sitemap | Blog | XML | Privacy Policy network supported

Leave a message

Leave a message
If you are interested in our products and want to know more details,please leave a message here,we will reply you as soon as we can.
submit

Home

Products

whatsApp

contact